
Page 135 - Big Data Analytics for Intelligent Healthcare Management
P. 135
128 CHAPTER 5 CHRONIC TTH ANALYSIS BY EMG AND GSR BIOFEEDBACK
EMGav: The rate of reduction of average duration of TTH with time was almost constant and
steady, which showed the efficiency of this technique, with a slight decrease in reduction rate in
the last period (6–12months) observed. Overall, the improvement observed in 1year was 9.01h/week,
which is better than the GSRav results.
Hence, we can conclude that the EMGav technique provides better improvement in decreasing the
TTH duration per week. EMGav is 114.89% more efficient than GSRav. In both the techniques/ther-
apies, there was a slight decrease in the rate of improvement of TTH duration observed from 6 to
12months that might have been the result of longer intimation gap for patients with the feedback pro-
cess (almost 6-month gap). Also, on analysis, one can add one more numerical value to this graph,
showing the rate of improvement. This can be easily done by calculating the slope of the line for dif-
ferent periods, which will provide the same base of comparison between EMG and GSR.
5.8.15 THE TREND OF AVERAGE INTENSITY
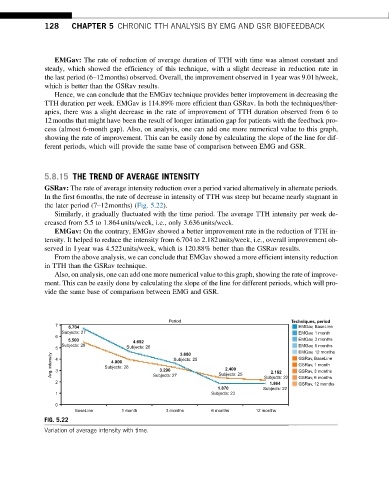
GSRav: The rate of average intensity reduction over a period varied alternatively in alternate periods.
In the first 6months, the rate of decrease in intensity of TTH was steep but became nearly stagnant in
the later period (7–12months) (Fig. 5.22).
Similarly, it gradually fluctuated with the time period. The average TTH intensity per week de-
creased from 5.5 to 1.864units/week, i.e., only 3.636units/week.
EMGav: On the contrary, EMGav showed a better improvement rate in the reduction of TTH in-
tensity. It helped to reduce the intensity from 6.704 to 2.182units/week, i.e., overall improvement ob-
served in 1year was 4.522units/week, which is 120.88% better than the GSRav results.
From the above analysis, we can conclude that EMGav showed a more efficient intensity reduction
in TTH than the GSRav technique.
Also, on analysis, one can add one more numerical value to this graph, showing the rate of improve-
ment. This can be easily done by calculating the slope of the line for different periods, which will pro-
vide the same base of comparison between EMG and GSR.
Period Techniques, period
7 6.704 EMGav, BaseLine
Subjects: 27 EMGav, 1 month
6
5.500 4.692 EMGav, 3 months
Subjects: 28 EMGav, 6 months
5 Subjects: 26
EMGav, 12 months
Avg. intensity 4 3 Subjects: 28 3.296 Subjects: 25 2.400 2.182 GSRav, 1 month
3.680
GSRav, BaseLine
4.000
GSRav, 3 months
2 Subjects: 27 Subjects: 25 Subjects: 22 GSRav, 6 months
1.864
GSRav, 12 months
1.870 Subjects: 22
1 Subjects: 23
0
BaseLine 1 month 3 months 6 months 12 months
FIG. 5.22
Variation of average intensity with time.