Page 137 - Big Data Analytics for Intelligent Healthcare Management
P. 137

130     CHAPTER 5 CHRONIC TTH ANALYSIS BY EMG AND GSR BIOFEEDBACK


                                                    Period                             Period
              Techni..   BaseLine     1 month      3 months    6 months     12 months    BaseLine
                                                                                         1 month
                    10                                                                   3 months
                                                                                         6 months
                                                                                         12 months
              EMGav TTH-intensity ---->  5  Average                                      1 2  19
                                                                                            20
                                                                                            22
                                                                                         4 3  21
                    0                                                                    5  23
                                                                                         6  24
                                                                                         7  25
                    10                                                                   8  26
                                                                                         9 10  27
                                                                                            28
              GSRav TTH-intensity ---->  5  Average                                      11
                                                                                         12
                                                                                         13
                                                                                         14
                    0                                                                    15
                           Average      Average      Average      Average      Average   16
                                                                                         17
                        0   10  20   0  10  20    0  10  20    0  10  20    0  10  20
                       TTH-duration (in h) ---->  TTH-duration (in h) ---->  TTH-duration (in h) ---->  TTH-duration (in h) ---->  TTH-duration (in h) ---->  18
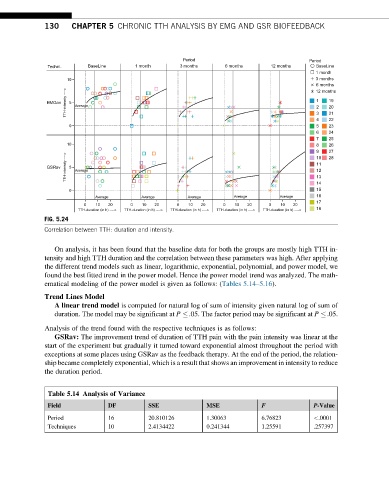
             FIG. 5.24
             Correlation between TTH: duration and intensity.


                On analysis, it has been found that the baseline data for both the groups are mostly high TTH in-
             tensity and high TTH duration and the correlation between these parameters was high. After applying
             the different trend models such as linear, logarithmic, exponential, polynomial, and power model, we
             found the best fitted trend in the power model. Hence the power model trend was analyzed. The math-
             ematical modeling of the power model is given as follows: (Tables 5.14–5.16).

             Trend Lines Model
                A linear trend model is computed for natural log of sum of intensity given natural log of sum of
                duration. The model may be significant at P  .05. The factor period may be significant at P  .05.
             Analysis of the trend found with the respective techniques is as follows:
                GSRav: The improvement trend of duration of TTH pain with the pain intensity was linear at the
             start of the experiment but gradually it turned toward exponential almost throughout the period with
             exceptions at some places using GSRav as the feedback therapy. At the end of the period, the relation-
             ship became completely exponential, which is a result that shows an improvement in intensity to reduce
             the duration period.


              Table 5.14 Analysis of Variance
                                                                          F
              Field            DF         SSE             MSE                           P-Value
              Period           16         20.810126       1.30063         6.76823       <.0001
              Techniques       10         2.4134422       0.241344        1.25591       .257397
   132   133   134   135   136   137   138   139   140   141   142