
Page 140 - Big Data Analytics for Intelligent Healthcare Management
P. 140
5.8 RESULTS, INTERPRETATION AND DISCUSSION 133
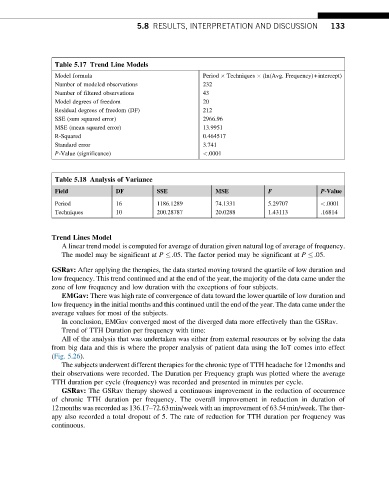
Table 5.17 Trend Line Models
Model formula Period Techniques (ln(Avg. Frequency)+intercept)
Number of modeled observations 232
Number of filtered observations 43
Model degrees of freedom 20
Residual degrees of freedom (DF) 212
SSE (sum squared error) 2966.96
MSE (mean squared error) 13.9951
R-Squared 0.464517
Standard error 3.741
P-Value (significance) <.0001
Table 5.18 Analysis of Variance
F
Field DF SSE MSE P-Value
Period 16 1186.1289 74.1331 5.29707 <.0001
Techniques 10 200.28787 20.0288 1.43113 .16814
Trend Lines Model
A linear trend model is computed for average of duration given natural log of average of frequency.
The model may be significant at P .05. The factor period may be significant at P .05.
GSRav: After applying the therapies, the data started moving toward the quartile of low duration and
low frequency. This trend continued and at the end of the year, the majority of the data came under the
zone of low frequency and low duration with the exceptions of four subjects.
EMGav: There was high rate of convergence of data toward the lower quartile of low duration and
low frequency in the initial months and this continued until the end of the year. The data came under the
average values for most of the subjects.
In conclusion, EMGav converged most of the diverged data more effectively than the GSRav.
Trend of TTH Duration per frequency with time:
All of the analysis that was undertaken was either from external resources or by solving the data
from big data and this is where the proper analysis of patient data using the IoT comes into effect
(Fig. 5.26).
The subjects underwent different therapies for the chronic type of TTH headache for 12months and
their observations were recorded. The Duration per Frequency graph was plotted where the average
TTH duration per cycle (frequency) was recorded and presented in minutes per cycle.
GSRav: The GSRav therapy showed a continuous improvement in the reduction of occurrence
of chronic TTH duration per frequency. The overall improvement in reduction in duration of
12months was recorded as 136.17–72.63min/week with an improvement of 63.54min/week. The ther-
apy also recorded a total dropout of 5. The rate of reduction for TTH duration per frequency was
continuous.