
Page 144 - Big Data Analytics for Intelligent Healthcare Management
P. 144
5.8 RESULTS, INTERPRETATION AND DISCUSSION 137
Period
7.571 EMGa, BaseLine
7.519
Subjects: 27 Subjects: 28 EMGa, 1 month
7 6.462 EMGa, 3 months
7.074 Subjects: 26 6.240
Subjects: 27 6.192 Subjects: 25 EMGa, 6 months
Subjects: 26 EMGa, 12 months
6
6.000 EMGav, BaseLine
Subjects: 27 5.760 EMGav, 1 month
Subjects: 25
4.604
5 Subjects: 25 Subjects: 24 EMGav, 3 months
5.320
Aug. frequency 4 Subjects: 23 3.450 EMGav, 12 months
EMGav, 6 months
4.478
EMGv, BaseLine
3.720
EMGv, 1 month
Subjects: 25
3
2.909
2.913 Subjects: 20 EMGv, 3 months
Subjects: 23 Subjects: 22 EMGv, 6 months
EMGv, 12 months
2
1
0
BaseLine 1 month 3 months 6 months 12 months
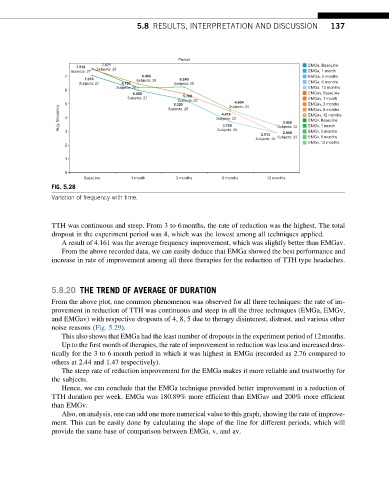
FIG. 5.28
Variation of frequency with time.
TTH was continuous and steep. From 3 to 6months, the rate of reduction was the highest. The total
dropout in the experiment period was 4, which was the lowest among all techniques applied.
A result of 4.161 was the average frequency improvement, which was slightly better than EMGav.
From the above recorded data, we can easily deduce that EMGa showed the best performance and
increase in rate of improvement among all three therapies for the reduction of TTH type headaches.
5.8.20 THE TREND OF AVERAGE OF DURATION
From the above plot, one common phenomenon was observed for all three techniques: the rate of im-
provement in reduction of TTH was continuous and steep in all the three techniques (EMGa, EMGv,
and EMGav) with respective dropouts of 4, 8, 5 due to therapy disinterest, distrust, and various other
noise reasons (Fig. 5.29).
This also shows that EMGa had the least number of dropouts in the experiment period of 12months.
Up to the first month of therapies, the rate of improvement in reduction was less and increased dras-
tically for the 3 to 6-month period in which it was highest in EMGa (recorded as 2.76 compared to
others at 2.44 and 1.47 respectively).
The steep rate of reduction improvement for the EMGa makes it more reliable and trustworthy for
the subjects.
Hence, we can conclude that the EMGa technique provided better improvement in a reduction of
TTH duration per week. EMGa was 180.89% more efficient than EMGav and 200% more efficient
than EMGv.
Also, on analysis, one can add one more numerical value to this graph, showing the rate of improve-
ment. This can be easily done by calculating the slope of the line for different periods, which will
provide the same base of comparison between EMGa, v, and av.