
Page 139 - Big Data Analytics for Intelligent Healthcare Management
P. 139
132 CHAPTER 5 CHRONIC TTH ANALYSIS BY EMG AND GSR BIOFEEDBACK
EMGav: There were dramatic results found just after applying this technique for 1month. The
trend became exponential after this period and moved toward becoming linear thereafter. This resulted
in five subjects falling outside of the quadrant of average low duration and average low intensity and
one subject with low intensity and average duration. Out of which one subject had a low duration with
high intensity and three subjects had low intensity with average duration.
Therefore, for duration, EMGav performed similar to GSRav and in terms of intensity, both EMGav
and GSRav had one subject with higher intensity, EMGav had one, and GSRav had two subjects with
average intensity and low duration.
We can conclude that EMGav had a better correlation between duration and intensity.
5.8.18 TREND ON CORRELATION OF TTH DURATION WITH OCCURRENCE
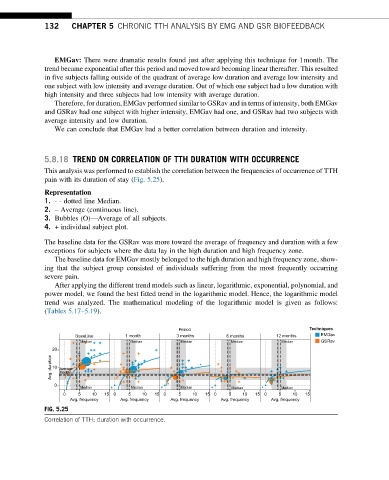
This analysis was performed to establish the correlation between the frequencies of occurrence of TTH
pain with its duration of stay (Fig. 5.25).
Representation
1. - - dotted line Median.
2. – Average (continuous line).
3. Bubbles (O)—Average of all subjects.
4. + individual subject plot.
The baseline data for the GSRav was more toward the average of frequency and duration with a few
exceptions for subjects where the data lay in the high duration and high frequency zone.
The baseline data for EMGav mostly belonged to the high duration and high frequency zone, show-
ing that the subject group consisted of individuals suffering from the most frequently occurring
severe pain.
After applying the different trend models such as linear, logarithmic, exponential, polynomial, and
power model, we found the best fitted trend in the logarithmic model. Hence, the logarithmic model
trend was analyzed. The mathematical modeling of the logarithmic model is given as follows:
(Tables 5.17–5.19).
Period Techniques
BaseLine 1 month 3 months 6 months 12 months EMGav
Median Median Median Median Median GSRav
20
Avg. duration 10 Average
Median
0
Median Median Median Median Median
0 5 10 15 0 5 10 15 0 5 10 15 0 5 10 15 0 5 10 15
Avg. frequency Avg. frequency Avg. frequency Avg. frequency Avg. frequency
FIG. 5.25
Correlation of TTH: duration with occurrence.