
Page 143 - Big Data Analytics for Intelligent Healthcare Management
P. 143
136 CHAPTER 5 CHRONIC TTH ANALYSIS BY EMG AND GSR BIOFEEDBACK
Techniques, period
7.074
7 Subjects: 27 EMGa, BaseLine
EMGa, 1 month
6.000 EMGa, 3 months
Subjects: 27 EMGa, 6 months
6
EMGa, 12 months
5.320
5.423 Subjects: 25 GSRa, BaseLine
Subjects: 26 GSRa, 1 month
5 GSRa, 3 months
5.115
Subjects: 26 GSRa, 6 months
4.087 GSRa, 12 months
Aug. frequency 4 Subjects: 24 3.720
Subjects: 23
3.792
Subjects: 25
2.913
3
Subjects: 23
2.714
Subjects: 21
2
1
0
BaseLine 1 month 3 months 6 months 12 months
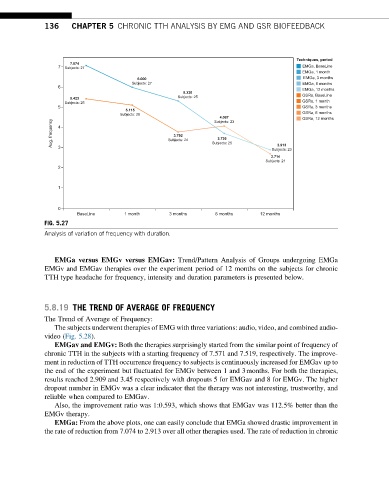
FIG. 5.27
Analysis of variation of frequency with duration.
EMGa versus EMGv versus EMGav: Trend/Pattern Analysis of Groups undergoing EMGa
EMGv and EMGav therapies over the experiment period of 12 months on the subjects for chronic
TTH type headache for frequency, intensity and duration parameters is presented below.
5.8.19 THE TREND OF AVERAGE OF FREQUENCY
The Trend of Average of Frequency:
The subjects underwent therapies of EMG with three variations: audio, video, and combined audio-
video (Fig. 5.28).
EMGav and EMGv: Both the therapies surprisingly started from the similar point of frequency of
chronic TTH in the subjects with a starting frequency of 7.571 and 7.519, respectively. The improve-
ment in reduction of TTH occurrence frequency to subjects is continuously increased for EMGav up to
the end of the experiment but fluctuated for EMGv between 1 and 3months. For both the therapies,
results reached 2.909 and 3.45 respectively with dropouts 5 for EMGav and 8 for EMGv. The higher
dropout number in EMGv was a clear indicator that the therapy was not interesting, trustworthy, and
reliable when compared to EMGav.
Also, the improvement ratio was 1:0.593, which shows that EMGav was 112.5% better than the
EMGv therapy.
EMGa: From the above plots, one can easily conclude that EMGa showed drastic improvement in
the rate of reduction from 7.074 to 2.913 over all other therapies used. The rate of reduction in chronic