
Page 145 - Big Data Analytics for Intelligent Healthcare Management
P. 145
138 CHAPTER 5 CHRONIC TTH ANALYSIS BY EMG AND GSR BIOFEEDBACK
Period
EMGa, BaseLine
15.11
Subjects: 27 EMGa, 1 month
EMGa, 3 months
14 13.19
Subjects: 27 EMGa, 6 months
EMGa, 12 months
11.59
11.39 EMGav, BaseLine
12 Subjects: 27
Subjects: 28 EMGav, 1 month
EMGav, 3 months
10 9.23 EMGav, 6 months
Subjects: 26 8.08 EMGav, 12 months
Aug. duration 8 Subjects: 25 Subjects: 25 Subjects: 25 EMGv, 1 month
EMGv, BaseLine
8.04
7.48
EMGv, 3 months
EMGv, 12 months
6.68 5.32 EMGv, 6 months
6 5.21
Subjects: 25 Subjects: 24 Subjects: 25 4.40
Subjects: 20
5.04 4.18
4 Subjects: 23 Subjects: 22
3.61
Subjects: 23
2
0
BaseLine 1 month 3 months 6 months 12 months
FIG. 5.29
Variation of average duration with time.
Period Techniques, period
7.536 EMGa, BaseLine
6.852 Subjects: 28 EMGa, 1 month
Subjects: 27 EMGa, 3 months
5.704
6.704 EMGa, 6 months
6 Subjects: 27
Subjects: 27
5.038 EMGa, 12 months
Subjects: 26 EMGav, BaseLine
Aug. intensity 4 Subjects: 26 Subjects: 25 Subjects: 25 Subjects: 24 2.500 EMGav, 1 month
3.680
4.692
3.640
3.333
EMGav, 3 months
EMGav, 6 months
3.333
Subjects: 24 3.080 Subjects: 20 EMGav, 12 months
Subjects: 25 EMGv, BaseLine
2 1.913
Subjects: 23 EMGv, 1 month
1.870
1.864 EMGv, 3 months
Subjects: 23
Subjects: 22
EMGv, 6 months
0 EMGv, 12 months
BaseLine 1 month 3 months 6 months 12 months
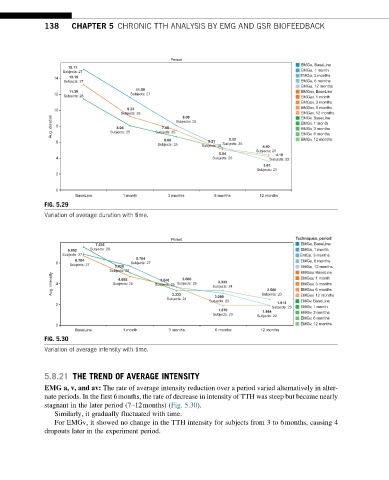
FIG. 5.30
Variation of average intensity with time.
5.8.21 THE TREND OF AVERAGE INTENSITY
EMG a, v, and av: The rate of average intensity reduction over a period varied alternatively in alter-
nate periods. In the first 6months, the rate of decrease in intensity of TTH was steep but became nearly
stagnant in the later period (7–12months) (Fig. 5.30).
Similarly, it gradually fluctuated with time.
For EMGv, it showed no change in the TTH intensity for subjects from 3 to 6months, causing 4
dropouts later in the experiment period.