
Page 149 - Big Data Analytics for Intelligent Healthcare Management
P. 149
142 CHAPTER 5 CHRONIC TTH ANALYSIS BY EMG AND GSR BIOFEEDBACK
Analysis of the trend found with the respective techniques are as follows:
EMGv: The improvement trend of duration of TTH pain with the pain intensity was exponential at
the start of the experiment but gradually turned toward linear almost throughout the period with a few
exceptions at some places using EMGv as a feedback therapy. At the end of the period, the relationship
became completely linear, which is a bad result in TTH duration and intensity.
Also, the analysis showed that most of the data came under the quadrant of low duration and low
intensity with the exceptions of four subjects, out of which two were having high intensity but low
duration and the other two were having average intensity but low duration at the end of 1year. There-
fore, EMGv is not an efficient technique.
EMGav: There were dramatic results just after applying this technique for 1month. The trend be-
came highly exponential after this period and moved toward becoming linear thereafter. This resulted
in three subjects falling outside the quadrant of low duration and low intensity, one subject with high
intensity and low duration and two with low intensity and high duration, proving that this technique is
not efficient.
EMGa: One can easily see that EMGa showed the best performance at the end of the year as there
were no cases reported outside the quadrant of low intensity and low duration after the therapy was
executed on the subjects for chronic type TTH for 12months.
We can conclude that EMGa has the best improvement correlation between duration and intensity.
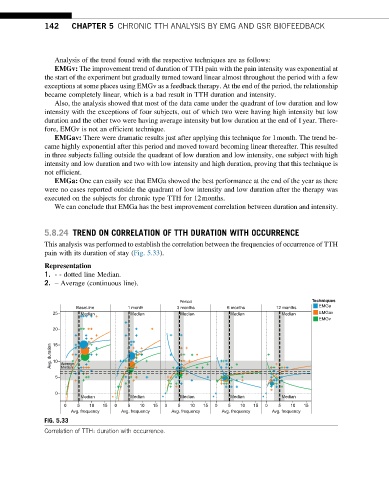
5.8.24 TREND ON CORRELATION OF TTH DURATION WITH OCCURRENCE
This analysis was performed to establish the correlation between the frequencies of occurrence of TTH
pain with its duration of stay (Fig. 5.33).
Representation
1. - - dotted line Median.
2. – Average (continuous line).
Period Techniques
EMGa
BaseLine 1 month 3 months 6 months 12 months
25 Median Median Median Median Median EMGav
EMGv
20
Avg. duration 15 Average
10
5 Median
0
Median Median Median Median Median
0 5 10 15 0 5 10 15 0 5 10 15 0 5 10 15 0 5 10 15
Avg. frequency Avg. frequency Avg. frequency Avg. frequency Avg. frequency
FIG. 5.33
Correlation of TTH: duration with occurrence.