
Page 151 - Big Data Analytics for Intelligent Healthcare Management
P. 151
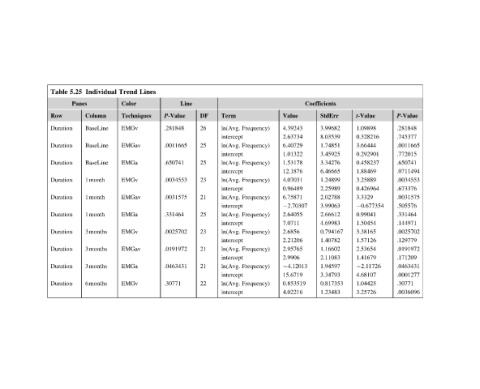
P-Value  .281848  .745377  .0011665  .772015  .650741  .0711494  .0034553  .673376  .0031575  .505576  .331464  .144971  .0025702  .129779  .0191972  .171209  .0463431  .0001277  .30771  .0036096


                                  t-Value  1.09898  0.328216  3.66444  0.292901  0.458237  1.88469  3.25889  0.426964  3.3329   0.677354  0.99041  1.50454  3.38165  1.57126  2.53654  1.41679   2.11726  4.68107  1.04425  3.25726


                              Coefficients  StdErr  3.99682  8.03539  1.74851  3.45925  3.34276  6.46665  1.24899  2.25989  2.02788  3.99063  2.66612  4.69983  0.794167  1.40782  1.16602  2.11083  1.94597  3.34793  0.817353  1.23483


                                  Value  4.39243  2.63734  6.40729  1.01322  1.53178  12.1876  4.07031  0.96489  6.75871   2.70307  2.64055  7.0711  2.6856  2.21206  2.95765  2.9906   4.12013  15.6719  0.853519  4.02216


                                     Frequency)  Frequency)  Frequency)  Frequency)  Frequency)  Frequency)  Frequency)  Frequency)  Frequency)  Frequency)


                                  Term  ln(Avg.  intercept  ln(Avg.  intercept  ln(Avg.  intercept  ln(Avg.  intercept  ln(Avg.  intercept  ln(Avg.  intercept  ln(Avg.  intercept  ln(Avg.  intercept  ln(Avg.  intercept  ln(Avg.  intercept


                                  DF  26  25   25  23   21   25   23   21  21   22

                              Line
                                  P-Value  .281848  .0011665  .650741  .0034553  .0031575  .331464  .0025702  .0191972  .0463431  .30771


                           Lines


                           Trend  Color  Techniques  EMGv  EMGav  EMGa  EMGv  EMGav  EMGa  EMGv  EMGav  EMGa  EMGv

                           Individual  Column  BaseLine  BaseLine  BaseLine  1month  1month  1month  3months  3months  3months  6months


                           5.25  Panes

                           Table  Row  Duration  Duration  Duration  Duration  Duration  Duration  Duration  Duration  Duration  Duration