
Page 131 - Big Data Analytics for Intelligent Healthcare Management
P. 131
124 CHAPTER 5 CHRONIC TTH ANALYSIS BY EMG AND GSR BIOFEEDBACK
Period Techniques
BaseLine 1 month 3 months 6 months 12 months EMGv
Median Median Median Median Median GSRv
20
Avg. duration 10 Average
Median
0
Median Median Median Median Median
0 5 10 15 0 5 10 15 0 5 10 15 0 5 10 15 0 5 10 15
Avg. frequency Avg. frequency Avg. frequency Avg. frequency Avg. frequency
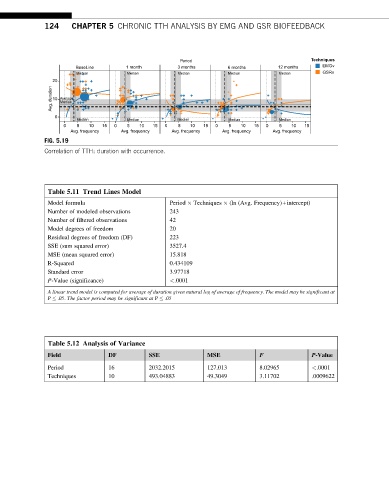
FIG. 5.19
Correlation of TTH: duration with occurrence.
Table 5.11 Trend Lines Model
Model formula Period Techniques (ln (Avg. Frequency)+intercept)
Number of modeled observations 243
Number of filtered observations 42
Model degrees of freedom 20
Residual degrees of freedom (DF) 223
SSE (sum squared error) 3527.4
MSE (mean squared error) 15.818
R-Squared 0.434109
Standard error 3.97718
P-Value (significance) <.0001
A linear trend model is computed for average of duration given natural log of average of frequency. The model may be significant at
P .05. The factor period may be significant at P .05
Table 5.12 Analysis of Variance
F
Field DF SSE MSE P-Value
Period 16 2032.2015 127.013 8.02965 <.0001
Techniques 10 493.04883 49.3049 3.11702 .0009622