
Page 129 - Big Data Analytics for Intelligent Healthcare Management
P. 129
122 CHAPTER 5 CHRONIC TTH ANALYSIS BY EMG AND GSR BIOFEEDBACK
Period Period
Techni.. BaseLine 1 month 3 months 6 months 12 months BaseLine
1 month
10 3 months
6 months
TTH-intensity ----> 1 19
12 months
EMGv 5 Average 2 20
4 3 21
22
0 5 23
6 24
7 25
10 8 26
9 10 27
TTH-intensity ----> 11 29
28
GSRv 5 Average 12
13
14
0 15
Average Average Average Average Average 16
0 10 20 0 10 20 0 10 20 0 10 20 0 10 20 17
TTH-duration (in h) ----> TTH-duration (in h) ----> TTH-duration (in h) ----> TTH-duration (in h) ----> TTH-duration (in h) ----> 18
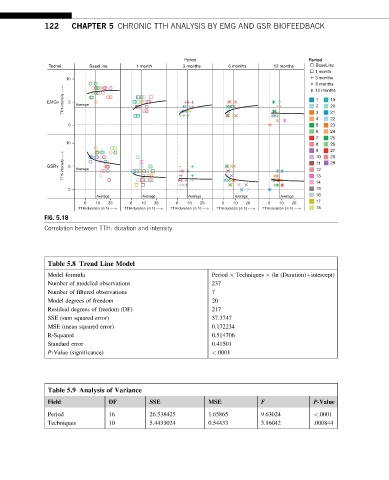
FIG. 5.18
Correlation between TTH: duration and intensity.
Table 5.8 Trend Line Model
Model formula Period Techniques (ln (Duration)+intercept)
Number of modeled observations 237
Number of filtered observations 7
Model degrees of freedom 20
Residual degrees of freedom (DF) 217
SSE (sum squared error) 37.3747
MSE (mean squared error) 0.172234
R-Squared 0.514706
Standard error 0.41501
P-Value (significance) <.0001
Table 5.9 Analysis of Variance
F
Field DF SSE MSE P-Value
Period 16 26.538425 1.65865 9.63024 <.0001
Techniques 10 5.4433024 0.54433 3.16042 .000844