
Page 124 - Big Data Analytics for Intelligent Healthcare Management
P. 124
5.8 RESULTS, INTERPRETATION AND DISCUSSION 117
Table 5.7 Individual Trend Lines
Panes Color Line Coefficients
Row Column Techniques P-Value DF Term Value StdErr t-Value P-Value
Duration BaseLine GSRa .226577 24 ln (Avg. 2.7703 2.2322 1.24106 .226577
Frequency)
intercept 7.96937 3.70551 2.15068 .0417848
Duration BaseLine EMGa .650741 25 ln (Avg. 1.53178 3.34276 0.458237 .650741
Frequency)
intercept 12.1876 6.46665 1.88469 .0711494
Duration 1month GSRa .123465 22 ln(Avg. 4.6758 2.91912 1.60179 .123465
Frequency)
intercept 1.55971 4.93291 0.316186 .754842
Duration 1month EMGa .331464 25 ln(Avg. 2.64055 2.66612 0.99041 .331464
Frequency)
intercept 7.0711 4.69983 1.50454 .144971
Duration 3months GSRa .0421601 22 ln(Avg. 3.05883 1.41782 2.15741 .0421601
Frequency)
intercept 1.83738 1.88265 0.975956 .339696
Duration 3months EMGa .0463431 21 ln(Avg. 4.12013 1.94597 2.11726 .0463431
Frequency)
intercept 15.6719 3.34793 4.68107 .0001277
Duration 6months GSRa .717234 20 ln(Avg. 0.42236 1.14982 0.367326 .717234
Frequency)
intercept 5.80349 1.64583 3.52617 .0021225
Duration 6months EMGa .120306 21 ln(Avg. 2.66436 1.64539 1.61929 .120306
Frequency)
intercept 9.37492 2.27736 4.11656 .0004917
Duration 12months GSRa .397623 17 ln(Avg. 0.680635 0.78438 0.867736 .397623
Frequency)
intercept 2.98464 0.86419 3.45369 .0030338
Duration 12months EMGa .256275 17 ln(Avg. 1.08554 0.924033 1.17478 .256275
Frequency)
intercept 3.13099 1.14255 2.74034 .0139474
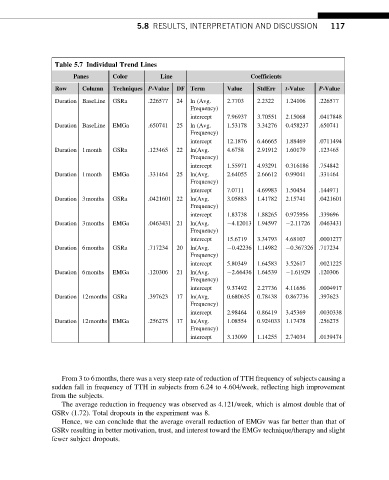
From 3 to 6months, there was a very steep rate of reduction of TTH frequency of subjects causing a
sudden fall in frequency of TTH in subjects from 6.24 to 4.604/week, reflecting high improvement
from the subjects.
The average reduction in frequency was observed as 4.121/week, which is almost double that of
GSRv (1.72). Total dropouts in the experiment was 8.
Hence, we can conclude that the average overall reduction of EMGv was far better than that of
GSRv resulting in better motivation, trust, and interest toward the EMGv technique/therapy and slight
fewer subject dropouts.