Page 120 - Big Data Analytics for Intelligent Healthcare Management
P. 120

5.8 RESULTS, INTERPRETATION AND DISCUSSION            113


                                                       Period                             Period
                 Techni..  BaseLine      1 month      3 months    6 months     12 months    BaseLine
                     12                                                                     1 month
                                 Trend line                                                 3 months
                                                                                            6 months
                     10
                                                                                            12 months
                      8                                                                     1
                                                                                            2 3
                EMGa  TTH-intensity ---->  6 4  Average                                     4 5 6


                                                                                            8 7
                      2                                                                     9
                                                                                            10
                      0                                                                     11
                                                                                            12
                                                                                            13
                     –2
                     12                                                                     14
                                                                                            15
                     10                                                                     16
                                                                                            17
                                                                                            18
                      8
                                                                                            19
                                                                                            20
                     TTH-intensity ---->  6                                                 21
                                                                                            22
                GSRa  4  Average                                                            23
                                                                                            24
                                                                                            26
                      2                                                                     25
                                                                                            27
                      0
                     –2      Average       Average      Average      Average      Average
                          0  10  20    0  10  20     0  10  20    0  10  20    0  10  20
                        TTH-duration (in h) ---->  TTH-duration (in h) ---->  TTH-duration (in h) ---->  TTH-duration (in h) ---->  TTH-duration (in h) ---->
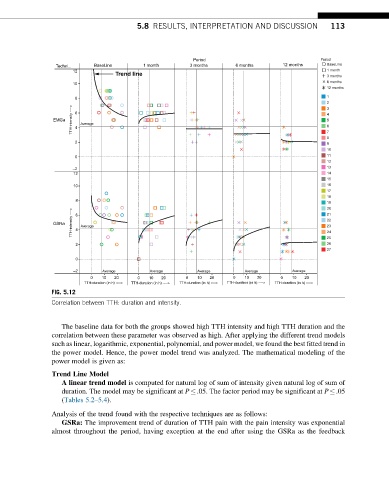
               FIG. 5.12
               Correlation between TTH: duration and intensity.


                  The baseline data for both the groups showed high TTH intensity and high TTH duration and the
               correlation between these parameter was observed as high. After applying the different trend models
               such as linear, logarithmic, exponential, polynomial, and power model, we found the best fitted trend in
               the power model. Hence, the power model trend was analyzed. The mathematical modeling of the
               power model is given as:

               Trend Line Model
                  A linear trend model is computed for natural log of sum of intensity given natural log of sum of
                  duration. The model may be significant at P .05. The factor period may be significant at P .05
                  (Tables 5.2–5.4).
               Analysis of the trend found with the respective techniques are as follows:
                  GSRa: The improvement trend of duration of TTH pain with the pain intensity was exponential
               almost throughout the period, having exception at the end after using the GSRa as the feedback
   115   116   117   118   119   120   121   122   123   124   125