
Page 122 - Big Data Analytics for Intelligent Healthcare Management
P. 122
5.8 RESULTS, INTERPRETATION AND DISCUSSION 115
technique. In the end of the period, the relationship became linear, which shows that further improve-
ment in intensity will linearly reduce the duration period.
Also, the analysis showed that the majority of the data was in the quadrant of low duration and low
intensity with the exception of three subjects out of which two were having high intensity but low
duration and one was having high duration but low intensity at the end of 1year.
EMGa: There were dramatic results found in the trend just after applying this technique for
1month. The trend became linear after this period and remained linear thereafter. This resulted in
no subjects falling outside the quadrant of average low duration and average low intensity.
We can conclude that EMGa had a better improvement correlation between duration and intensity.
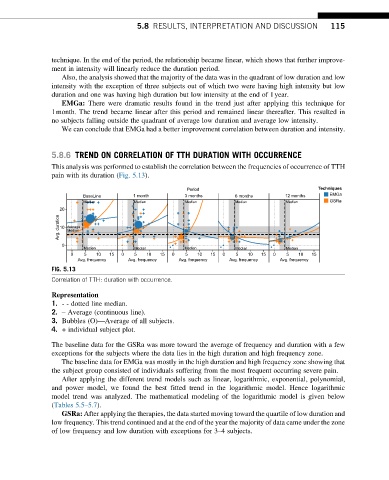
5.8.6 TREND ON CORRELATION OF TTH DURATION WITH OCCURRENCE
This analysis was performed to establish the correlation between the frequencies of occurrence of TTH
pain with its duration (Fig. 5.13).
Period Techniques
BaseLine 1 month 3 months 6 months 12 months EMGa
Median Median Median Median Median GSRa
20
Avg. duration 10 Average
Median
0
Median Median Median Median Median
0 5 10 15 0 5 10 15 0 5 10 15 0 5 10 15 0 5 10 15
Avg. frequency Avg. frequency Avg. frequency Avg. frequency Avg. frequency
FIG. 5.13
Correlation of TTH: duration with occurrence.
Representation
1. - - dotted line median.
2. – Average (continuous line).
3. Bubbles (O)—Average of all subjects.
4. + individual subject plot.
The baseline data for the GSRa was more toward the average of frequency and duration with a few
exceptions for the subjects where the data lies in the high duration and high frequency zone.
The baseline data for EMGa was mostly in the high duration and high frequency zone showing that
the subject group consisted of individuals suffering from the most frequent occurring severe pain.
After applying the different trend models such as linear, logarithmic, exponential, polynomial,
and power model, we found the best fitted trend in the logarithmic model. Hence logarithmic
model trend was analyzed. The mathematical modeling of the logarithmic model is given below
(Tables 5.5–5.7).
GSRa: After applying the therapies, the data started moving toward the quartile of low duration and
low frequency. This trend continued and at the end of the year the majority of data came under the zone
of low frequency and low duration with exceptions for 3–4 subjects.