
Page 121 - Big Data Analytics for Intelligent Healthcare Management
P. 121
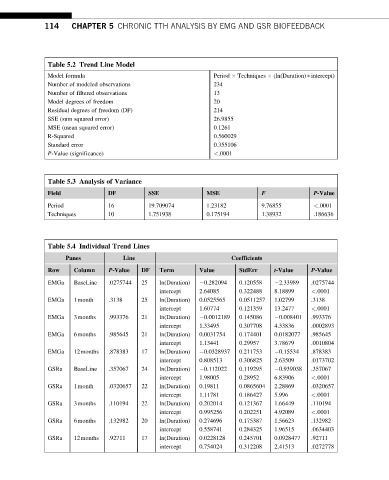
114     CHAPTER 5 CHRONIC TTH ANALYSIS BY EMG AND GSR BIOFEEDBACK


              Table 5.2 Trend Line Model
              Model formula                                 Period   Techniques   (ln(Duration)+intercept)
              Number of modeled observations                234
              Number of filtered observations               13
              Model degrees of freedom                      20
              Residual degrees of freedom (DF)              214
              SSE (sum squared error)                       26.9855
              MSE (mean squared error)                      0.1261
              R-Squared                                     0.560029
              Standard error                                0.355106
              P-Value (significance)                        <.0001


              Table 5.3 Analysis of Variance
                                                                          F
              Field            DF         SSE             MSE                           P-Value
              Period           16         19.709074       1.23182         9.76855       <.0001
              Techniques       10         1.751938        0.175194        1.38932       .186636


              Table 5.4 Individual Trend Lines
                   Panes           Line                          Coefficients
              Row     Column   P-Value  DF   Term       Value      StdErr    t-Value   P-Value
              EMGa    BaseLine  .0275744  25  ln(Duration)   0.282094  0.120558   2.33989  .0275744
                                             intercept  2.64085    0.322488  8.18899   <.0001
              EMGa    1month   .3138    25   ln(Duration)  0.0525565  0.0511257  1.02799  .3138
                                             intercept  1.60774    0.121359  13.2477   <.0001
              EMGa    3months  .993376  21   ln(Duration)   0.0012189  0.145086   0.008401  .993376
                                             intercept  1.33495    0.307708  4.33836   .0002893
              EMGa    6months  .985645  21   ln(Duration)  0.0031754  0.174401  0.0182077  .985645
                                             intercept  1.13441    0.29957   3.78679   .0010804
              EMGa    12months  .878383  17  ln(Duration)   0.0328937  0.211753   0.15534  .878383
                                             intercept  0.808513   0.306825  2.63509   .0173702
              GSRa    BaseLine  .357067  24  ln(Duration)   0.112022  0.119295   0.939038  .357067
                                             intercept  1.98005    0.28952   6.83906   <.0001
              GSRa    1month   .0320657  22  ln(Duration)  0.19811  0.0865604  2.28869  .0320657
                                             intercept  1.11781    0.186427  5.996     <.0001
              GSRa    3months  .110194  22   ln(Duration)  0.202014  0.121367  1.66449  .110194
                                             intercept  0.995256   0.202251  4.92089   <.0001
              GSRa    6months  .132982  20   ln(Duration)  0.274696  0.175387  1.56623  .132982
                                             intercept  0.558741   0.284325  1.96515   .0634403
              GSRa    12months  .92711  17   ln(Duration)  0.0228128  0.245701  0.0928477  .92711
                                             intercept  0.754024   0.312208  2.41513   .0272778