
Page 74 - Big Data Analytics for Intelligent Healthcare Management
P. 74
4.6 RESULT AND ANALYSIS 67
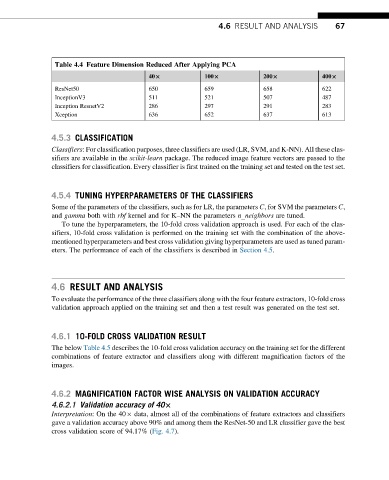
Table 4.4 Feature Dimension Reduced After Applying PCA
40× 100× 200× 400×
ResNet50 650 659 658 622
InceptionV3 511 521 507 487
Inception ResnetV2 286 297 291 283
Xception 636 652 637 613
4.5.3 CLASSIFICATION
Classifiers: For classification purposes, three classifiers are used (LR, SVM, and K-NN). All these clas-
sifiers are available in the scikit-learn package. The reduced image feature vectors are passed to the
classifiers for classification. Every classifier is first trained on the training set and tested on the test set.
4.5.4 TUNING HYPERPARAMETERS OF THE CLASSIFIERS
Some of the parameters of the classifiers, such as for LR, the parameters C, for SVM the parameters C,
and gamma both with rbf kernel and for K–NN the parameters n_neighbors are tuned.
To tune the hyperparameters, the 10-fold cross validation approach is used. For each of the clas-
sifiers, 10-fold cross validation is performed on the training set with the combination of the above-
mentioned hyperparameters and best cross validation giving hyperparameters are used as tuned param-
eters. The performance of each of the classifiers is described in Section 4.5.
4.6 RESULT AND ANALYSIS
To evaluate the performance of the three classifiers along with the four feature extractors, 10-fold cross
validation approach applied on the training set and then a test result was generated on the test set.
4.6.1 10-FOLD CROSS VALIDATION RESULT
The below Table 4.5 describes the 10-fold cross validation accuracy on the training set for the different
combinations of feature extractor and classifiers along with different magnification factors of the
images.
4.6.2 MAGNIFICATION FACTOR WISE ANALYSIS ON VALIDATION ACCURACY
4.6.2.1 Validation accuracy of 40×
Interpretation: On the 40 data, almost all of the combinations of feature extractors and classifiers
gave a validation accuracy above 90% and among them the ResNet-50 and LR classifier gave the best
cross validation score of 94.17% (Fig. 4.7).