
Page 27 - Bio Engineering Approaches to Cancer Diagnosis and Treatment
P. 27
24 CHAPTER 2 Diagnostic imaging in cancer
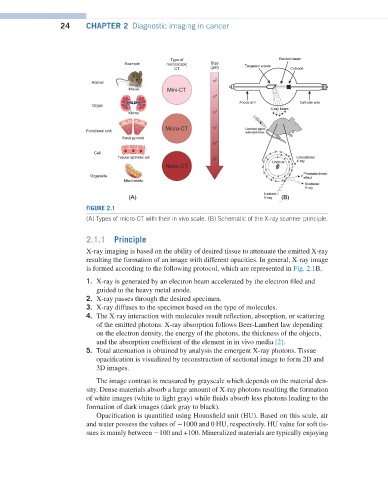
FIGURE 2.1
(A) Types of micro-CT with their in vivo scale. (B) Schematic of the X-ray scanner principle.
2.1.1 Principle
X-ray imaging is based on the ability of desired tissue to attenuate the emitted X-ray
resulting the formation of an image with different opacities. In general, X-ray image
is formed according to the following protocol, which are represented in Fig. 2.1B.
1. X-ray is generated by an electron beam accelerated by the electron filed and
guided to the heavy metal anode.
2. X-ray passes through the desired specimen.
3. X-ray diffuses to the specimen based on the type of molecules.
4. The X-ray interaction with molecules result reflection, absorption, or scattering
of the emitted photons. X-ray absorption follows Beer-Lambert law depending
on the electron density, the energy of the photons, the thickness of the objects,
and the absorption coefficient of the element in in vivo media [2].
5. Total attenuation is obtained by analysis the emergent X-ray photons. Tissue
opacification is visualized by reconstruction of sectional image to form 2D and
3D images.
The image contrast is measured by grayscale which depends on the material den-
sity. Dense materials absorb a large amount of X-ray photons resulting the formation
of white images (white to light gray) while fluids absorb less photons leading to the
formation of dark images (dark gray to black).
Opacification is quantified using Hounsfield unit (HU). Based on this scale, air
and water possess the values of −1000 and 0 HU, respectively. HU value for soft tis-
sues is mainly between −100 and +100. Mineralized materials are typically enjoying