
Page 227 - Biodegradable Polyesters
P. 227
8.6 FTIR Analysis 205
8.6
FTIR Analysis
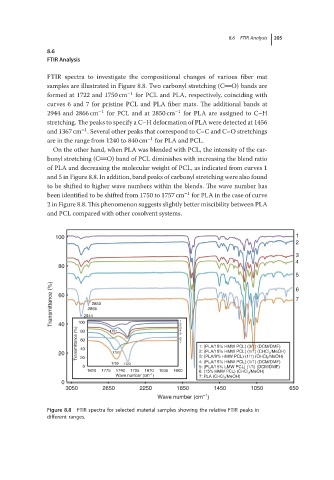
FTIR spectra to investigate the compositional changes of various fiber mat
samples are illustrated in Figure 8.8. Two carbonyl stretching (C O) bands are
formed at 1722 and 1750 cm −1 for PCL and PLA, respectively, coinciding with
curves 6 and 7 for pristine PCL and PLA fiber mats. The additional bands at
2944 and 2866 cm −1 for PCL and at 2850 cm −1 for PLA are assigned to C–H
stretching. The peaks to specify a C–H deformation of PLA were detected at 1456
−1
and 1367 cm . Several other peaks that correspond to C–C and C–O stretchings
are in the range from 1240 to 840 cm −1 forPLA andPCL.
On the other hand, when PLA was blended with PCL, the intensity of the car-
bonyl stretching (C O) band of PCL diminishes with increasing the blend ratio
of PLA and decreasing the molecular weight of PCL, as indicated from curves 1
and 5 in Figure 8.8. In addition, band peaks of carbonyl stretching were also found
to be shifted to higher wave numbers within the blends. The wave number has
been identified to be shifted from 1750 to 1757 cm −1 forPLA in thecaseofcurve
2 in Figure 8.8. This phenomenon suggests slightly better miscibility between PLA
and PCL compared with other cosolvent systems.
100 1
2
3
4
80
5
Transmittance (%) 60 100 2944 2850 1 7
6
2866
40
Transmittance (%) 80 1757 2 3 4 5 6 7 1: (PLA/15% HMW PCL) (3/1) (DCM/DMF)
60
20 40 1751 2: (PLA/15% HMW PCL) (1/1) (CHCl 3 /MeOH)
3: (PLA/9% HMW PCL) (1/1) (CHCl 3 /MeOH)
20
1750 1722 4: (PLA/15% HMW PCL) (1/1) (DCM/DMF)
0 5: (PLA/15% LMW PCL) (1/1) (DCM/DMF)
1810 1775 1740 1705 1670 1635 1600 6: (15% HMW PCL) (CHCl 3 /MeOH)
–1
Wave number (cm ) 7: PLA (CHCl 3 /MeOH)
0
3050 2650 2250 1850 1450 1050 650
–1
Wave number (cm )
Figure 8.8 FTIR spectra for selected material samples showing the relative FTIR peaks in
different ranges.