
Page 246 - Biofuels Refining and Performance
P. 246
Cracking of Lipids for Fuels and Chemicals 229
35 MJ/kg of animal fat. All reaction products show relatively low vis-
cosity and densities.
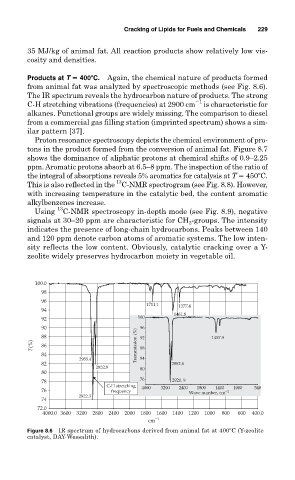
Products at T 400 C. Again, the chemical nature of products formed
from animal fat was analyzed by spectroscopic methods (see Fig. 8.6).
The IR spectrum reveals the hydrocarbon nature of products. The strong
1
C-H stretching vibrations (frequencies) at 2900 cm is characteristic for
alkanes. Functional groups are widely missing. The comparison to diesel
from a commercial gas filling station (imprinted spectrum) shows a sim-
ilar pattern [37].
Proton resonance spectroscopy depicts the chemical environment of pro-
tons in the product formed from the conversion of animal fat. Figure 8.7
shows the dominance of aliphatic protons at chemical shifts of 0.9–2.25
ppm. Aromatic protons absorb at 6.5–8 ppm. The inspection of the ratio of
the integral of absorptions reveals 5% aromatics for catalysis at T 450 C.
13
This is also reflected in the C-NMR spectrogram (see Fig. 8.8). However,
with increasing temperature in the catalytic bed, the content aromatic
alkylbenzenes increase.
13
Using C-NMR spectroscopy in-depth mode (see Fig. 8.9), negative
signals at 30–20 ppm are characteristic for CH -groups. The intensity
2
indicates the presence of long-chain hydrocarbons. Peaks between 140
and 120 ppm denote carbon atoms of aromatic systems. The low inten-
sity reflects the low content. Obviously, catalytic cracking over a Y-
zeolite widely preserves hydrocarbon moiety in vegetable oil.
100.0
98
96
1711.1 1377.4
94
1461.8
92 100
90 96
88 92 1457.9
T(%) 86 Transmission (%) 88
84
2955.4 84
82 2852.4
2852.9 80
80
78 76 2920. 9
C-H stretching 4000 3200 2400 1800 1400 1000 540
76 frequency Wave number, cm −1
2922.3
74
72.0
4000.0 3600 3200 2800 2400 2000 1800 1600 1400 1200 1000 800 600 400.0
cm −1
Figure 8.6 IR spectrum of hydrocarbons derived from animal fat at 400 C (Y-zeolite
catalyst, DAY-Wessalith).