
Page 242 - Biofuels Refining and Performance
P. 242
Cracking of Lipids for Fuels and Chemicals 225
algae, seeds, or vegetable oils emerging from the passage showed a uni-
form, high-octane, aromatic gasoline product. Obviously, the molecular
pattern of products is insensitive to the nature of lipids used. This is in
contrast to pyrolysis without a catalyst [18].
Upgrading of crude tall oil to fuels and chemicals has been studied at
atmospheric pressure and in the temperature range of 370–440 C, in a
fixed-bed microreactor containing H-ZSM-5 [32]. The oil was co-fed with
diluents such as tetralin, methanol, and steam. High oil conversions, in
the range of 80–90 wt.%, were obtained using tetralin and methanol as
diluents. Conversions under steam were reduced to 36–70 wt.%. The
maximum concentration of gasoline-range aromatic hydrocarbons was
52–57 wt.% with tetralin and steam, but only 39% with methanol. The
amount of gas product in most runs was 1–4 wt.% [32].
8.3 Vegetable Oil Fuels/Hydrocarbon Blends
balance. However,
At first glance vegetable oil offers a favorable CO 2
when the extra N O emission from biofuel production is calculated in
2
“CO -equivalent” global warming terms, and compared with the quasi-
2
cooling effect of “saving” emissions of fossil fuel derived CO , the out-
2
come is that production of commonly used biofuels can contribute as
much or more to global warming by N O emissions than cooling by fossil
2
fuel savings [33]. In addition, widespread use of vegetable oil fuels is lim-
ited by high viscosity, low volatility, poor cold flow behavior, and lack of
oxidation stability during storage [6, 7]. Partial conversion of vegetable
oil to hydrocarbons offers the possibility to preserve the favorable envi-
ronmental characteristics of vegetable oil-based fuels while improving
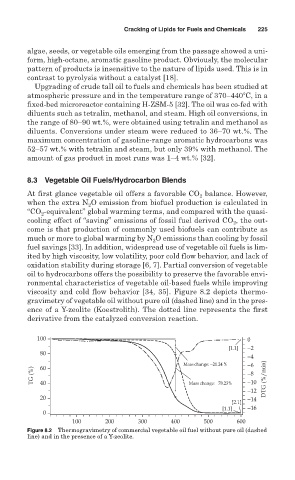
viscosity and cold flow behavior [34, 35]. Figure 8.2 depicts thermo-
gravimetry of vegetable oil without pure oil (dashed line) and in the pres-
ence of a Y-zeolite (Koestrolith). The dotted line represents the first
derivative from the catalyzed conversion reaction.
100 0
[1.1] −2
80
−4
Mass change: −21.24 % −6
60
TG (%) 40 Mass change: −78.23% −8 DTG (%/min)
−10
−12
20 −14
[2.1]
[1.1] −16
0
100 200 300 400 500 600
Figure 8.2 Thermogravimetry of commercial vegetable oil fuel without pure oil (dashed
line) and in the presence of a Y-zeolite.