
Page 243 - Biofuels Refining and Performance
P. 243
226 Chapter Eight
100.0
95
3006.44 2359.85 1633.78
90
1376.88
85
1458.40 1096.13 721.85
80
T(%) 75
2852.42 1159.96
70
65
2921.92
60
1743.18
55.0
4000.0 3000 2000 1500 1000 540.0
cm −1
Figure 8.3 IR spectrum of commercial vegetable oil fuel. The bands observed at around
2900 and 1740 cm 1 are due to absorption of IR radiation, the absorbed energy causing
transitions between energy levels for the stretching vibrations of C-H (hydrocarbons)
and C O bonds (ester function R 1 COOR 2 ), respectively.
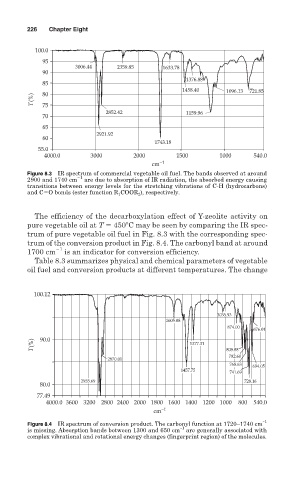
The efficiency of the decarboxylation effect of Y-zeolite activity on
pure vegetable oil at T 450 C may be seen by comparing the IR spec-
trum of pure vegetable oil fuel in Fig. 8.3 with the corresponding spec-
trum of the conversion product in Fig. 8.4. The carbonyl band at around
1700 cm 1 is an indicator for conversion efficiency.
Table 8.3 summarizes physical and chemical parameters of vegetable
oil fuel and conversion products at different temperatures. The change
100.12
1035.93
1605.08
874.00
676.01
T(%) 90.0 1377.31 809.88
782.60
2870.01
768.63
694.05
1457.75
741.69
2955.69 728.16
80.0
77.49
4000.0 3600 3200 2800 2400 2000 1800 1600 1400 1200 1000 800 540.0
cm −1
Figure 8.4 IR spectrum of conversion product. The carbonyl function at 1720–1740 cm −1
is missing. Absorption bands between 1300 and 650 cm −1 are generally associated with
complex vibrational and rotational energy changes (fingerprint region) of the molecules.