
Page 431 - Biofuels for a More Sustainable Future
P. 431
An aggregated life cycle sustainability index 383
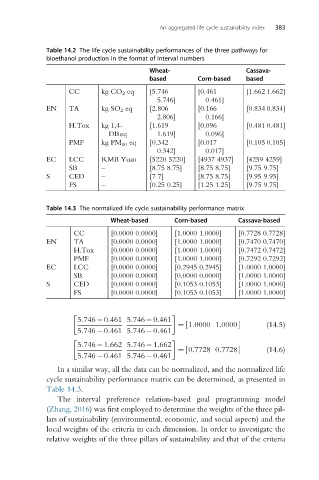
Table 14.2 The life cycle sustainability performances of the three pathways for
bioethanol production in the format of interval numbers
Wheat- Cassava-
based Corn-based based
CC kg CO 2 eq [5.746 [0.461 [1.662 1.662]
5.746] 0.461]
EN TA kg SO 2 eq [2.806 [0.166 [0.834 0.834]
2.806] 0.166]
H.Tox kg 1,4- [1.619 [0.096 [0.481 0.481]
DBeq 1.619] 0.096]
PMF kg PM 10 eq [0.342 [0.017 [0.105 0.105]
0.342] 0.017]
EC LCC RMB Yuan [5220 5220] [4937 4937] [4259 4259]
SB – [8.75 8.75] [8.75 8.75] [9.75 9.75]
S CED – [7 7] [8.75 8.75] [9.95 9.95]
FS – [0.25 0.25] [1.25 1.25] [9.75 9.75]
Table 14.3 The normalized life cycle sustainability performance matrix
Wheat-based Corn-based Cassava-based
CC [0.0000 0.0000] [1.0000 1.0000] [0.7728 0.7728]
EN TA [0.0000 0.0000] [1.0000 1.0000] [0.7470 0.7470]
H.Tox [0.0000 0.0000] [1.0000 1.0000] [0.7472 0.7472]
PMF [0.0000 0.0000] [1.0000 1.0000] [0.7292 0.7292]
EC LCC [0.0000 0.0000] [0.2945 0.2945] [1.0000 1.0000]
SB [0.0000 0.0000] [0.0000 0.0000] [1.0000 1.0000]
S CED [0.0000 0.0000] [0.1053 0.1053] [1.0000 1.0000]
FS [0.0000 0.0000] [0.1053 0.1053] [1.0000 1.0000]
5:746 0:461 5:746 0:461
½
¼ 1:0000 1:0000 (14.5)
5:746 0:461 5:746 0:461
5:746 1:662 5:746 1:662
¼ 0:7728 0:7728 (14.6)
½
5:746 0:461 5:746 0:461
In a similar way, all the data can be normalized, and the normalized life
cycle sustainability performance matrix can be determined, as presented in
Table 14.3.
The interval preference relation-based goal programming model
(Zhang, 2016) was first employed to determine the weights of the three pil-
lars of sustainability (environmental, economic, and social aspects) and the
local weights of the criteria in each dimension. In order to investigate the
relative weights of the three pillars of sustainability and that of the criteria