
Page 435 - Biofuels for a More Sustainable Future
P. 435
An aggregated life cycle sustainability index 387
Table 14.7 The weighted normalized life cycle sustainability performance matrix
Cassava- Ideal
Wheat-based Corn-based based solutions
CC [0.0000 [0.1231 [0.0951 0.2997
0.0000] 0.2997] 0.2316]
EN TA [0.0000 [0 0.1458] [0 0.1089] 0.1458
0.0000]
H.Tox [0.0000 [0.0953 [0.0712 0.2650
0.0000] 0.2650] 0.1980]
PMF [0.0000 [0.0179 [0.0131 0.1682
0.0000] 0.1682] 0.1227]
EC LCC [0.0000 [0.0487 [0.1653 0.3122
0.0000] 0.0919] 0.3122]
SB [0.0000 [0.0000 [0.0103 0.0125
0.0000] 0.0000] 0.0125]
S CED [0.0000 [0.0110 [0.0185 0.0304
0.0000] 0.0180] 0.0304]
FS [0.0000 [0.0058 [0.0547 0.0709
0.0000] 0.0075] 0.0709]
0.50
0.4681
0.4277
0.40
Projections 0.30
0.20
0.1890
0.1449
0.10
0.0000
0.00
Wheat-based Corn-based Cassava-based
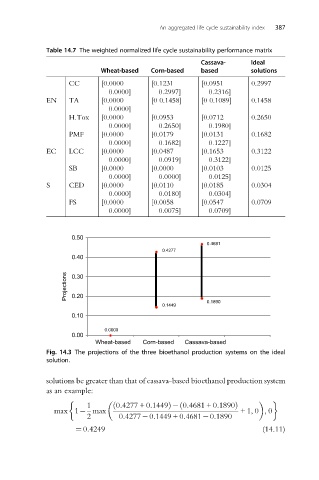
Fig. 14.3 The projections of the three bioethanol production systems on the ideal
solution.
solutions be greater than that of cassava-based bioethanol production system
as an example:
1 ð 0:4277 + 0:1449Þ 0:4681 + 0:1890Þ
ð
max 1 max +1, 0 ,0
2 0:4277 0:1449 + 0:4681 0:1890
¼ 0:4249 (14.11)