
Page 249 - Biomedical Engineering and Design Handbook Volume 1, Fundamentals
P. 249
226 BIOMECHANICS OF THE HUMAN BODY
increases and volume fraction decreases, the architecture becomes increasingly rodlike, and these
rods become progressively thin and can be perforated. Quantification of trabecular architecture with
the intent of understanding its role in the mechanical behavior of trabecular bone has been the
subject of intense research. In addition to calculating trabecular thickness, spacing, and surface-
to-volume ratio, stereological and three-dimensional methods may be used to determine the mean
17
orientation (main grain axis) of the trabeculae, connectivity, and the degree of anisotropy. While
earlier studies used two-dimensional sections of trabecular bone to perform these architectural
analyses, 18,19 more recent investigations use three-dimensional reconstructions generated by micro-
computed tomography and other high-resolution imaging techniques. 16,20–22
9.4 MECHANICAL PROPERTIES OF CORTICAL BONE
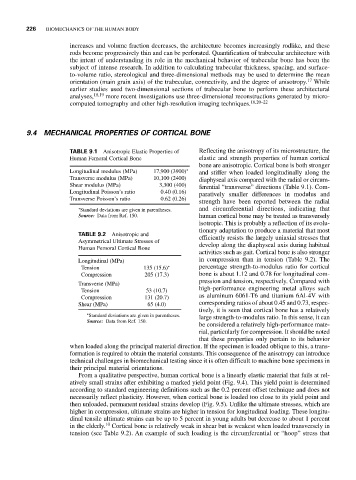
TABLE 9.1 Anisotropic Elastic Properties of Reflecting the anisotropy of its microstructure, the
Human Femoral Cortical Bone elastic and strength properties of human cortical
bone are anisotropic. Cortical bone is both stronger
Longitudinal modulus (MPa) 17,900 (3900) ∗ and stiffer when loaded longitudinally along the
Transverse modulus (MPa) 10,100 (2400) diaphyseal axis compared with the radial or circum-
Shear modulus (MPa) 3,300 (400) ferential “transverse” directions (Table 9.1). Com-
Longitudinal Poisson’s ratio 0.40 (0.16) paratively smaller differences in modulus and
Transverse Poisson’s ratio 0.62 (0.26)
strength have been reported between the radial
∗ and circumferential directions, indicating that
Standard deviations are given in parentheses.
Source: Data from Ref. 150. human cortical bone may be treated as transversely
isotropic. This is probably a reflection of its evolu-
tionary adaptation to produce a material that most
TABLE 9.2 Anisotropic and
Asymmetrical Ultimate Stresses of efficiently resists the largely uniaxial stresses that
Human Femoral Cortical Bone develop along the diaphyseal axis during habitual
activities such as gait. Cortical bone is also stronger
Longitudinal (MPa) in compression than in tension (Table 9.2). The
Tension 135 (15.6) ∗ percentage strength-to-modulus ratio for cortical
Compression 205 (17.3) bone is about 1.12 and 0.78 for longitudinal com-
pression and tension, respectively. Compared with
Transverse (MPa)
Tension 53 (10.7) high-performance engineering metal alloys such
Compression 131 (20.7) as aluminum 6061-T6 and titanium 6Al-4V with
Shear (MPa) 65 (4.0) corresponding ratios of about 0.45 and 0.73, respec-
tively, it is seen that cortical bone has a relatively
∗
Standard deviations are given in parentheses. large strength-to-modulus ratio. In this sense, it can
Source: Data from Ref. 150.
be considered a relatively high-performance mate-
rial, particularly for compression. It should be noted
that these properties only pertain to its behavior
when loaded along the principal material direction. If the specimen is loaded oblique to this, a trans-
formation is required to obtain the material constants. This consequence of the anisotropy can introduce
technical challenges in biomechanical testing since it is often difficult to machine bone specimens in
their principal material orientations.
From a qualitative perspective, human cortical bone is a linearly elastic material that fails at rel-
atively small strains after exhibiting a marked yield point (Fig. 9.4). This yield point is determined
according to standard engineering definitions such as the 0.2 percent offset technique and does not
necessarily reflect plasticity. However, when cortical bone is loaded too close to its yield point and
then unloaded, permanent residual strains develop (Fig. 9.5). Unlike the ultimate stresses, which are
higher in compression, ultimate strains are higher in tension for longitudinal loading. These longitu-
dinal tensile ultimate strains can be up to 5 percent in young adults but decrease to about 1 percent
10
in the elderly. Cortical bone is relatively weak in shear but is weakest when loaded transversely in
tension (see Table 9.2). An example of such loading is the circumferential or “hoop” stress that