
Page 253 - Biomedical Engineering and Design Handbook Volume 1, Fundamentals
P. 253
230 BIOMECHANICS OF THE HUMAN BODY
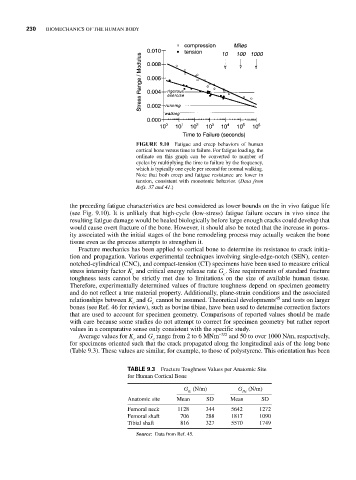
FIGURE 9.10 Fatigue and creep behaviors of human
cortical bone versus time to failure. For fatigue loading, the
ordinate on this graph can be converted to number of
cycles by multiplying the time to failure by the frequency,
which is typically one cycle per second for normal walking.
Note that both creep and fatigue resistance are lower in
tension, consistent with monotonic behavior. (Data from
Refs. 37 and 41.)
the preceding fatigue characteristics are best considered as lower bounds on the in vivo fatigue life
(see Fig. 9.10). It is unlikely that high-cycle (low-stress) fatigue failure occurs in vivo since the
resulting fatigue damage would be healed biologically before large enough cracks could develop that
would cause overt fracture of the bone. However, it should also be noted that the increase in poros-
ity associated with the initial stages of the bone remodeling process may actually weaken the bone
tissue even as the process attempts to strengthen it.
Fracture mechanics has been applied to cortical bone to determine its resistance to crack initia-
tion and propagation. Various experimental techniques involving single-edge-notch (SEN), center-
notched-cylindrical (CNC), and compact-tension (CT) specimens have been used to measure critical
stress intensity factor K and critical energy release rate G . Size requirements of standard fracture
c
c
toughness tests cannot be strictly met due to limitations on the size of available human tissue.
Therefore, experimentally determined values of fracture toughness depend on specimen geometry
and do not reflect a true material property. Additionally, plane-strain conditions and the associated
45
relationships between K and G cannot be assumed. Theoretical developments and tests on larger
c
c
bones (see Ref. 46 for review), such as bovine tibiae, have been used to determine correction factors
that are used to account for specimen geometry. Comparisons of reported values should be made
with care because some studies do not attempt to correct for specimen geometry but rather report
values in a comparative sense only consistent with the specific study.
Average values for K and G range from 2 to 6 MNm −3/2 and 50 to over 1000 N/m, respectively,
c
c
for specimens oriented such that the crack propagated along the longitudinal axis of the long bone
(Table 9.3). These values are similar, for example, to those of polystyrene. This orientation has been
TABLE 9.3 Fracture Toughness Values per Anatomic Site
for Human Cortical Bone
G (N/m) G (N/m)
Ic IIc
Anatomic site Mean SD Mean SD
Femoral neck 1128 344 5642 1272
Femoral shaft 706 288 1817 1090
Tibial shaft 816 327 5570 1749
Source: Data from Ref. 45.