
Page 256 - Biomedical Engineering and Design Handbook Volume 1, Fundamentals
P. 256
BONE MECHANICS 233
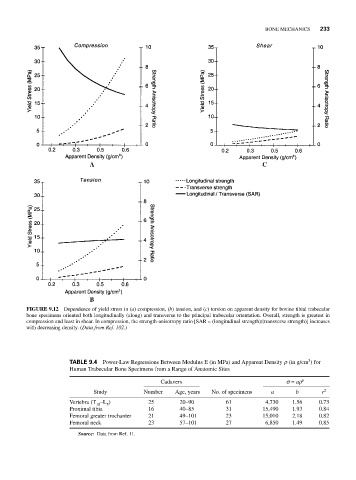
FIGURE 9.12 Dependence of yield stress in (a) compression, (b) tension, and (c) torsion on apparent density for bovine tibial trabecular
bone specimens oriented both longitudinally (along) and transverse to the principal trabecular orientation. Overall, strength is greatest in
compression and least in shear. In compression, the strength-anisotropy ratio [SAR = (longitudinal strength)/(transverse strength)] increases
with decreasing density. (Data from Ref. 102.)
3
TABLE 9.4 Power-Law Regressions Between Modulus E (in MPa) and Apparent Density r (in g/cm ) for
Human Trabecular Bone Specimens from a Range of Anatomic Sites
Cadavers s = ar b
Study Number Age, years No. of specimens a b r 2
Vertebra (T –L ) 25 20–90 61 4,730 1.56 0.73
10 5
Proximal tibia 16 40–85 31 15,490 1.93 0.84
Femoral greater trochanter 21 49–101 23 15,010 2.18 0.82
Femoral neck 23 57–101 27 6,850 1.49 0.85
Source: Data from Ref. 11.