
Page 257 - Biomedical Engineering and Design Handbook Volume 1, Fundamentals
P. 257
234 BIOMECHANICS OF THE HUMAN BODY
3
TABLE 9.5 Power-Law Regressions Between Ultimate Stress s (in MPa) and Apparent Density r (in g/cm )
for Compressive Loading of Human Trabecular Bone Specimens from a Range of Anatomic Sites
Cadavers s = ar b
Study Number Age, years No. of specimens a b r 2
Proximal tibia
Linde et al., 1989 151 9 59–82 121 34.2 1.56 0.79
Proximal femur
Lotz et al., 1990 131 4 25–82 49 25.0 1.80 0.93
Lumbar spine
Hansson et al., 1987 88 3 71–84 231 50.3 2.24 0.76
Mosekilde et al., 1987 78 42 15–87 40 24.9 1.80 0.83
1.0
Compression Tension *
0.8 *
Yield Strain (%) 0.6 0.35 –0.62 0.67 –0.57
0.4
0.2
0.0
Vertebra Proximal Tibia Trochanter Femoral Neck
Anatomic Site
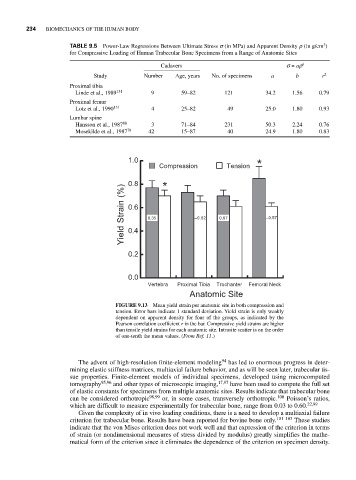
FIGURE 9.13 Mean yield strain per anatomic site in both compression and
tension. Error bars indicate 1 standard deviation. Yield strain is only weakly
dependent on apparent density for four of the groups, as indicated by the
Pearson correlation coefficient r in the bar. Compressive yield strains are higher
than tensile yield strains for each anatomic site. Intrasite scatter is on the order
of one-tenth the mean values. (From Ref. 11.)
The advent of high-resolution finite-element modeling 94 has led to enormous progress in deter-
mining elastic stiffness matrices, multiaxial failure behavior, and as will be seen later, trabecular tis-
sue properties. Finite-element models of individual specimens, developed using microcomputed
tomography 95,96 and other types of microscopic imaging, 17,97 have been used to compute the full set
of elastic constants for specimens from multiple anatomic sites. Results indicate that trabecular bone
can be considered orthotropic 98,99 or, in some cases, transversely orthotropic. 100 Poisson’s ratios,
which are difficult to measure experimentally for trabecular bone, range from 0.03 to 0.60. 22,99
Given the complexity of in vivo loading conditions, there is a need to develop a multiaxial failure
criterion for trabecular bone. Results have been reported for bovine bone only. 101–103 These studies
indicate that the von Mises criterion does not work well and that expression of the criterion in terms
of strain (or nondimensional measures of stress divided by modulus) greatly simplifies the mathe-
matical form of the criterion since it eliminates the dependence of the criterion on specimen density.