
Page 48 - Biomedical Engineering and Design Handbook Volume 1, Fundamentals
P. 48
MODELING OF BIOMEDICAL SYSTEMS 25
the form of a minimum or maximum operation. Since the dysphagia classification involves estimat-
ing the severity of the disease, Suryanarayanan et al. (1995) used the maximum rule.
Using the maximum rule, the output membership value corresponding to the severe risk (Φ ) can
1
be calculated as
Φ = [μ (x)V μ (y)V μ (z)] (1.64)
1 a,1 b,1 c,1
The output membership value corresponding to the moderate risk can be expressed as
Φ = [(μ (x)V μ (y)V μ (z)] (1.65)
2 a,2 b,2 c,2
The output membership value corresponding to the mild risk can be expressed as
Φ = [(μ (x)V μ (y)V μ (z)] (1.66)
3 a,3 b,3 c,3
The output membership value corresponding to the normal risk can be expressed as
Φ = [(μ (x)V μ (y)V μ (z)] (1.67)
4 a,4 b,4 c,4
where V indicates the maximum operator.
The output can be defuzzified using certroid defuzzification scheme to obtain a crisp value C.
⎡ ∑ j = 4 jΦ ⎤
C = ⎢ j =1 j ⎥ (1.68)
⎢ ∑ j = 4 Φ ⎥
⎣ j =1 j ⎦
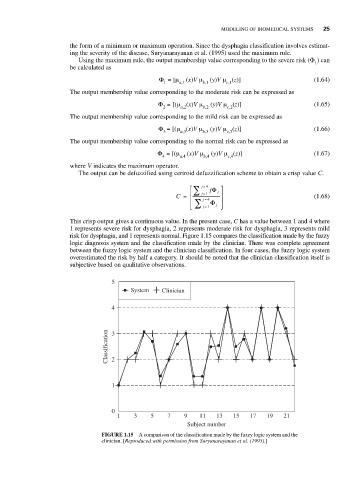
This crisp output gives a continuous value. In the present case, C has a value between 1 and 4 where
1 represents severe risk for dysphagia, 2 represents moderate risk for dysphagia, 3 represents mild
risk for dysphagia, and 1 represents normal. Figure 1.15 compares the classification made by the fuzzy
logic diagnosis system and the classification made by the clinician. There was complete agreement
between the fuzzy logic system and the clinician classification. In four cases, the fuzzy logic system
overestimated the risk by half a category. It should be noted that the clinician classification itself is
subjective based on qualitative observations.
5
System Clinician
4
Classification 3 2
1
0
1 3 5 7 9 11 13 15 17 19 21
Subject number
FIGURE 1.15 A comparison of the classification made by the fuzzy logic system and the
clinician. [Reproduced with permission from Suryanarayanan et al. (1995).]