
Page 141 - Biomedical Engineering and Design Handbook Volume 2, Applications
P. 141
120 MEDICAL DEVICE DESIGN
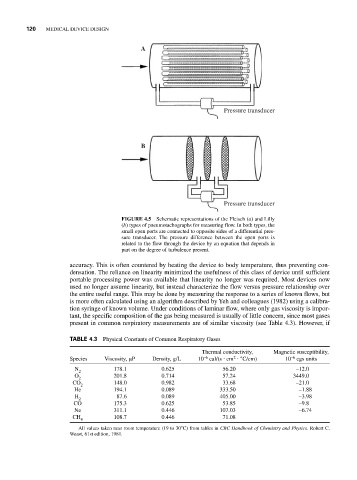
A
Pressure transducer
B
Pressure transducer
FIGURE 4.5 Schematic representations of the Fleisch (a) and Lilly
(b) types of pneumotachographs for measuring flow. In both types, the
small open ports are connected to opposite sides of a differential pres-
sure transducer. The pressure difference between the open ports is
related to the flow through the device by an equation that depends in
part on the degree of turbulence present.
accuracy. This is often countered by heating the device to body temperature, thus preventing con-
densation. The reliance on linearity minimized the usefulness of this class of device until sufficient
portable processing power was available that linearity no longer was required. Most devices now
used no longer assume linearity, but instead characterize the flow versus pressure relationship over
the entire useful range. This may be done by measuring the response to a series of known flows, but
is more often calculated using an algorithm described by Yeh and colleagues (1982) using a calibra-
tion syringe of known volume. Under conditions of laminar flow, where only gas viscosity is impor-
tant, the specific composition of the gas being measured is usually of little concern, since most gases
present in common respiratory measurements are of similar viscosity (see Table 4.3). However, if
TABLE 4.3 Physical Constants of Common Respiratory Gases
Thermal conductivity, Magnetic susceptibility,
–6
2
–6
Species Viscosity, μP Density, g/L 10 cal/(s ⋅ cm ⋅°C/cm) 10 cgs units
N 2 178.1 0.625 56.20 –12.0
O 201.8 0.714 57.24 3449.0
2
CO 2 148.0 0.982 33.68 –21.0
He 194.1 0.089 333.50 –1.88
H 2 87.6 0.089 405.00 –3.98
CO 175.3 0.625 53.85 –9.8
Ne 311.1 0.446 107.03 –6.74
CH 108.7 0.446 71.08
4
All values taken near room temperature (19 to 30°C) from tables in CRC Handbook of Chemistry and Physics. Robert C.
Weast, 61st edition, 1981.