
Page 146 - Biomedical Engineering and Design Handbook Volume 2, Applications
P. 146
DESIGN OF RESPIRATORY DEVICES 125
Ionization
Needle chamber High vacuum
valve + +
pump
– –
Light filter
Linearization
circuit
Light detector
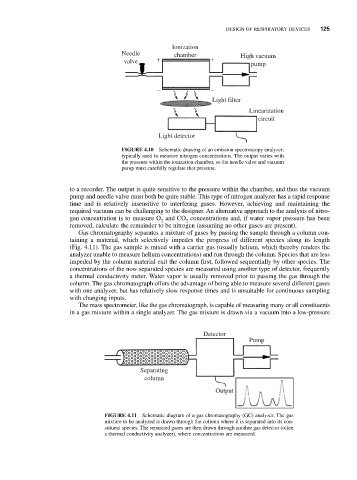
FIGURE 4.10 Schematic drawing of an emission spectroscopy analyzer,
typically used to measure nitrogen concentrations. The output varies with
the pressure within the ionization chamber, so the needle valve and vacuum
pump must carefully regulate that pressure.
to a recorder. The output is quite sensitive to the pressure within the chamber, and thus the vacuum
pump and needle valve must both be quite stable. This type of nitrogen analyzer has a rapid response
time and is relatively insensitive to interfering gases. However, achieving and maintaining the
required vacuum can be challenging to the designer. An alternative approach to the analysis of nitro-
gen concentration is to measure O and CO concentrations and, if water vapor pressure has been
2 2
removed, calculate the remainder to be nitrogen (assuming no other gases are present).
Gas chromatography separates a mixture of gases by passing the sample through a column con-
taining a material, which selectively impedes the progress of different species along its length
(Fig. 4.11). The gas sample is mixed with a carrier gas (usually helium, which thereby renders the
analyzer unable to measure helium concentrations) and run through the column. Species that are less
impeded by the column material exit the column first, followed sequentially by other species. The
concentrations of the now separated species are measured using another type of detector, frequently
a thermal conductivity meter. Water vapor is usually removed prior to passing the gas through the
column. The gas chromatograph offers the advantage of being able to measure several different gases
with one analyzer, but has relatively slow response times and is unsuitable for continuous sampling
with changing inputs.
The mass spectrometer, like the gas chromatograph, is capable of measuring many or all constituents
in a gas mixture within a single analyzer. The gas mixture is drawn via a vacuum into a low-pressure
Detector
Pump
Separating
column
Output
FIGURE 4.11 Schematic diagram of a gas chromatography (GC) analyzer. The gas
mixture to be analyzed is drawn through the column where it is separated into its con-
stituent species. The separated gases are then drawn through another gas detector (often
a thermal conductivity analyzer), where concentrations are measured.