
Page 340 - Biomimetics : Biologically Inspired Technologies
P. 340
Bar-Cohen : Biomimetics: Biologically Inspired Technologies DK3163_c012 Final Proof page 326 21.9.2005 11:55pm
326 Biomimetics: Biologically Inspired Technologies
0.125 in Copper fiber (cross-section)
Polymer matrix
0.125 in
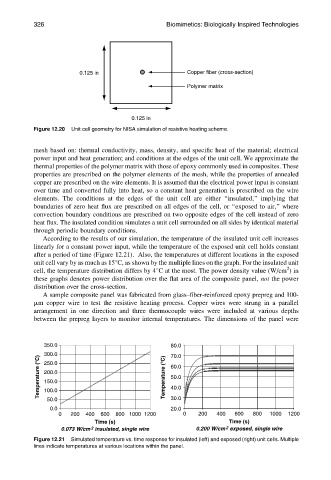
Figure 12.20 Unit cell geometry for NISA simulation of resistive heating scheme.
mesh based on: thermal conductivity, mass, density, and specific heat of the material; electrical
power input and heat generation; and conditions at the edges of the unit cell. We approximate the
thermal properties of the polymer matrix with those of epoxy commonly used in composites. These
properties are prescribed on the polymer elements of the mesh, while the properties of annealed
copper are prescribed on the wire elements. It is assumed that the electrical power input is constant
over time and converted fully into heat, so a constant heat generation is prescribed on the wire
elements. The conditions at the edges of the unit cell are either ‘‘insulated,’’ implying that
boundaries of zero heat flux are prescribed on all edges of the cell, or ‘‘exposed to air,’’ where
convection boundary conditions are prescribed on two opposite edges of the cell instead of zero
heat flux. The insulated condition simulates a unit cell surrounded on all sides by identical material
through periodic boundary conditions.
According to the results of our simulation, the temperature of the insulated unit cell increases
linearly for a constant power input, while the temperature of the exposed unit cell holds constant
after a period of time (Figure 12.21). Also, the temperatures at different locations in the exposed
unit cell vary by as much as 158C, as shown by the multiple lines on the graph. For the insulated unit
2
cell, the temperature distribution differs by 48C at the most. The power density value (W/cm )in
these graphs denotes power distribution over the flat area of the composite panel, not the power
distribution over the cross-section.
A sample composite panel was fabricated from glass–fiber-reinforced epoxy prepreg and 100-
mm copper wire to test the resistive heating process. Copper wires were strung in a parallel
arrangement in one direction and three thermocouple wires were included at various depths
between the prepreg layers to monitor internal temperatures. The dimensions of the panel were
350.0 80.0
300.0 70.0
Temperature ( C) 200.0 Temperature ( C) 60.0
250.0
50.0
150.0
40.0
100.0
50.0 30.0
0.0 20.0
0 200 400 600 800 1000 1200 0 200 400 600 800 1000 1200
Time (s) Time (s)
2
0.073 W/cm insulated, single wire 0.200 W/cm exposed, single wire
2
Figure 12.21 Simulated temperature vs. time response for insulated (left) and exposed (right) unit cells. Multiple
lines indicate temperatures at various locations within the panel.