
Page 341 - Biomimetics : Biologically Inspired Technologies
P. 341
Bar-Cohen : Biomimetics: Biologically Inspired Technologies DK3163_c012 Final Proof page 327 21.9.2005 11:55pm
Multifunctional Materials 327
...
12 wire sets connected in series,
where each wire set contains 4 copper
wires connected in parallel
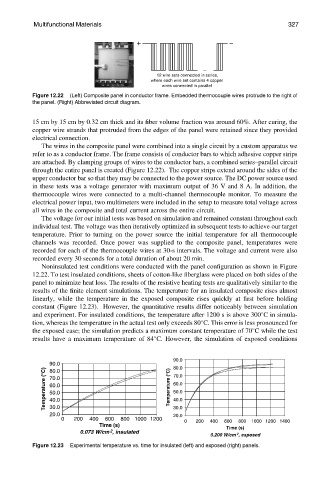
Figure 12.22 (Left) Composite panel in conductor frame. Embedded thermocouple wires protrude to the right of
the panel. (Right) Abbreviated circuit diagram.
15 cm by 15 cm by 0.32 cm thick and its fiber volume fraction was around 60%. After curing, the
copper wire strands that protruded from the edges of the panel were retained since they provided
electrical connection.
The wires in the composite panel were combined into a single circuit by a custom apparatus we
refer to as a conductor frame. The frame consists of conductor bars to which adhesive copper strips
are attached. By clamping groups of wires to the conductor bars, a combined series–parallel circuit
through the entire panel is created (Figure 12.22). The copper strips extend around the sides of the
upper conductor bar so that they may be connected to the power source. The DC power source used
in these tests was a voltage generator with maximum output of 36 V and 8 A. In addition, the
thermocouple wires were connected to a multi-channel thermocouple monitor. To measure the
electrical power input, two multimeters were included in the setup to measure total voltage across
all wires in the composite and total current across the entire circuit.
The voltage for our initial tests was based on simulation and remained constant throughout each
individual test. The voltage was then iteratively optimized in subsequent tests to achieve our target
temperature. Prior to turning on the power source the initial temperature for all thermocouple
channels was recorded. Once power was supplied to the composite panel, temperatures were
recorded for each of the thermocouple wires at 30-s intervals. The voltage and current were also
recorded every 30 seconds for a total duration of about 20 min.
Noninsulated test conditions were conducted with the panel configuration as shown in Figure
12.22. To test insulated conditions, sheets of cotton-like fiberglass were placed on both sides of the
panel to minimize heat loss. The results of the resistive heating tests are qualitatively similar to the
results of the finite element simulations. The temperature for an insulated composite rises almost
linearly, while the temperature in the exposed composite rises quickly at first before holding
constant (Figure 12.23). However, the quantitative results differ noticeably between simulation
and experiment. For insulated conditions, the temperature after 1200 s is above 3008C in simula-
tion, whereas the temperature in the actual test only exceeds 808C. This error is less pronounced for
the exposed case; the simulation predicts a maximum constant temperature of 708C while the test
results have a maximum temperature of 848C. However, the simulation of exposed conditions
90.0
90.0 80.0
Temperature ( C) 70.0 Temperature ( C) 60.0
80.0
70.0
60.0
50.0
50.0
40.0
40.0
30.0
20.0 30.0
20.0
0 200 400 600 800 1000 1200 0 200 400 600 800 1000 1200 1400
Time (s)
Time (s)
2
0.073 W/cm , insulated
0.200 W/cm , exposed
2
Figure 12.23 Experimental temperature vs. time for insulated (left) and exposed (right) panels.