
Page 126 - Boiler_Operators_Handbook,_Second_Edition
P. 126
What the Wise Operator Knows 111
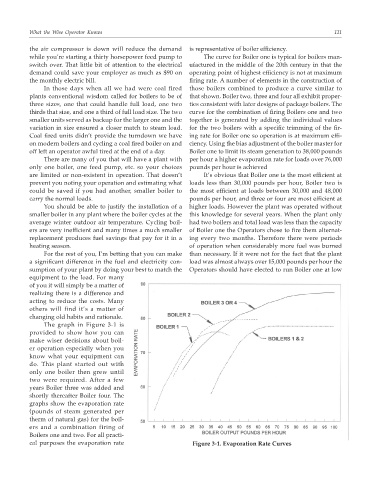
the air compressor is down will reduce the demand is representative of boiler efficiency.
while you’re starting a thirty horsepower feed pump to The curve for Boiler one is typical for boilers man-
switch over. That little bit of attention to the electrical ufactured in the middle of the 20th century in that the
demand could save your employer as much as $90 on operating point of highest efficiency is not at maximum
the monthly electric bill. firing rate. A number of elements in the construction of
In those days when all we had were coal fired those boilers combined to produce a curve similar to
plants conventional wisdom called for boilers to be of that shown. Boiler two, three and four all exhibit proper-
three sizes, one that could handle full load, one two ties consistent with later designs of package boilers. The
thirds that size, and one a third of full load size. The two curve for the combination of firing Boilers one and two
smaller units served as backup for the larger one and the together is generated by adding the individual values
variation in size ensured a closer match to steam load. for the two boilers with a specific trimming of the fir-
Coal fired units didn’t provide the turndown we have ing rate for Boiler one so operation is at maximum effi-
on modern boilers and cycling a coal fired boiler on and ciency. Using the bias adjustment of the boiler master for
off left an operator awful tired at the end of a day. Boiler one to limit its steam generation to 38,000 pounds
There are many of you that will have a plant with per hour a higher evaporation rate for loads over 76,000
only one boiler, one feed pump, etc. so your choices pounds per hour is achieved
are limited or non-existent in operation. That doesn’t It’s obvious that Boiler one is the most efficient at
prevent you noting your operation and estimating what loads less than 30,000 pounds per hour, Boiler two is
could be saved if you had another, smaller boiler to the most efficient at loads between 30,000 and 48,000
carry the normal loads. pounds per hour, and three or four are most efficient at
You should be able to justify the installation of a higher loads. However the plant was operated without
smaller boiler in any plant where the boiler cycles at the this knowledge for several years. When the plant only
average winter outdoor air temperature. Cycling boil- had two boilers and total load was less than the capacity
ers are very inefficient and many times a much smaller of Boiler one the Operators chose to fire them alternat-
replacement produces fuel savings that pay for it in a ing every two months. Therefore there were periods
heating season. of operation when considerably more fuel was burned
For the rest of you, I’m betting that you can make than necessary. If it were not for the fact that the plant
a significant difference in the fuel and electricity con- load was almost always over 15,000 pounds per hour the
sumption of your plant by doing your best to match the Operators should have elected to run Boiler one at low
equipment to the load. For many
of you it will simply be a matter of
realizing there is a difference and
acting to reduce the costs. Many
others will find it’s a matter of
changing old habits and rationale.
The graph in Figure 3-1 is
provided to show how you can
make wiser decisions about boil-
er operation especially when you
know what your equipment can
do. This plant started out with
only one boiler then grew until
two were required. After a few
years Boiler three was added and
shortly thereafter Boiler four. The
graphs show the evaporation rate
(pounds of steam generated per
therm of natural gas) for the boil-
ers and a combination firing of
Boilers one and two. For all practi-
cal purposes the evaporation rate Figure 3-1. Evaporation Rate Curves