
Page 44 - Budgeting for Managers
P. 44
The Parts of a Budget
27
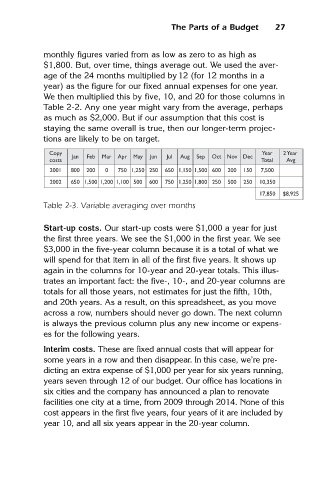
monthly figures varied from as low as zero to as high as
$1,800. But, over time, things average out. We used the aver-
age of the 24 months multiplied by12 (for 12 months in a
year) as the figure for our fixed annual expenses for one year.
We then multiplied this by five, 10, and 20 for those columns in
Table 2-2. Any one year might vary from the average, perhaps
as much as $2,000. But if our assumption that this cost is
staying the same overall is true, then our longer-term projec-
tions are likely to be on target.
Copy Year 2 Year
Jan Feb Mar Apr May Jun Jul Aug Sep Oct Nov Dec
costs Total Avg
2001 800 200 0 750 1,250 250 650 1,150 1,500 600 200 150 7,500
2002 650 1,500 1,200 1,100 500 600 750 1,250 1,800 250 500 250 10,350
17,850 $8,925
Table 2-3. Variable averaging over months
Start-up costs. Our start-up costs were $1,000 a year for just
the first three years. We see the $1,000 in the first year. We see
$3,000 in the five-year column because it is a total of what we
will spend for that item in all of the first five years. It shows up
again in the columns for 10-year and 20-year totals. This illus-
trates an important fact: the five-, 10-, and 20-year columns are
totals for all those years, not estimates for just the fifth, 10th,
and 20th years. As a result, on this spreadsheet, as you move
across a row, numbers should never go down. The next column
is always the previous column plus any new income or expens-
es for the following years.
Interim costs. These are fixed annual costs that will appear for
some years in a row and then disappear. In this case, we’re pre-
dicting an extra expense of $1,000 per year for six years running,
years seven through 12 of our budget. Our office has locations in
six cities and the company has announced a plan to renovate
facilities one city at a time, from 2009 through 2014. None of this
cost appears in the first five years, four years of it are included by
year 10, and all six years appear in the 20-year column.