
Page 129 - Building A Succesful Board-Test Strategy
P. 129
Inspection as Test 115
3,3.4.3 The Infrared Test Process
To build the good-board model, a test engineer views a computer image of
the board, highlights each component and area of interest with the computer's
mouse, identifies the component, and enters other pertinent data. From this infor-
mation and a user-supplied input pattern that mimics the board's actual operation,
the system assembles a database.
Next, an operator feeds production boards to the system, positioning each
board's tooling holes on matching tooling pins in the isothermal chamber. The
tooling pins and I/O connectors represent the only "fixture" that the method requires.
Each board generates a set of infrared images when executing the test pattern. A
statistical analysis of the resulting signatures produces the standard against which
the system will measure each board during testing. The tester will flag any uncovered
outliers in the sample as bad boards, and does not include them in the standard.
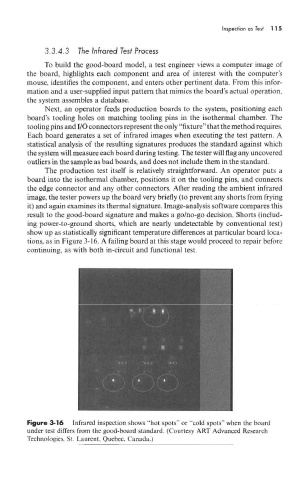
The production test itself is relatively straightforward. An operator puts a
board into the isothermal chamber, positions it on the tooling pins, and connects
the edge connector and any other connectors. After reading the ambient infrared
image, the tester powers up the board very briefly (to prevent any shorts from frying
it) and again examines its thermal signature. Image-analysis software compares this
result to the good-board signature and makes a go/no-go decision. Shorts (includ-
ing power-to-ground shorts, which are nearly undetectable by conventional test)
show up as statistically significant temperature differences at particular board loca-
tions, as in Figure 3-1.6. A failing board at this stage would proceed to repair before
continuing, as with both in-circuit and functional test.
Figure 3-16 Infrared inspection shows "hot spots" or "cold spots" when the board
under test differs from the good-board standard. (Courtesy ART Advanced Research
Technologies, St. Laurent, Quebec, Canada.)