
Page 140 - Building A Succesful Board-Test Strategy
P. 140
126 BUILDING A SUCCESSFUL BOARD-TEST STRATEGY
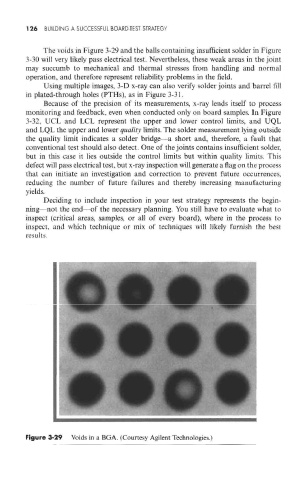
The voids in Figure 3-29 and the balls containing insufficient solder in Figure
3-30 will very likely pass electrical test. Nevertheless, these weak areas in the joint
may succumb to mechanical and thermal stresses from handling and normal
operation, and therefore represent reliability problems in the field.
Using multiple images, 3-D x-ray can also verify solder joints and barrel fill
in plated-through holes (PTHs), as in Figure 3-31.
Because of the precision of its measurements, x-ray lends itself to process
monitoring and feedback, even when conducted only on board samples. In Figure
3-32, UCL and LCL represent the upper and lower control limits, and UQL
and LQL the upper and lower quality limits. The solder measurement lying outside
the quality limit indicates a solder bridge—a short and, therefore, a fault that
conventional test should also detect. One of the joints contains insufficient solder,
but in this case it lies outside the control limits but within quality limits. This
detect will pass electrical test, but x-ray inspection will generate a flag on the process
that can initiate an investigation and correction to prevent future occurrences,
reducing the number of future failures and thereby increasing manufacturing
yields.
Deciding to include inspection in your test strategy represents the begin-
ning— not the end—of the necessary planning. You still have to evaluate what to
inspect (critical areas, samples, or all of every board), where in the process to
inspect, and which technique or mix of techniques will likely furnish the best
results.
Figure 3-29 Voids in a EGA. (Courtesy Agilent Technologies.)