
Page 42 - Building A Succesful Board-Test Strategy
P. 42
28 BUILDING A SUCCESSFUL BOARD-TEST STRATEGY
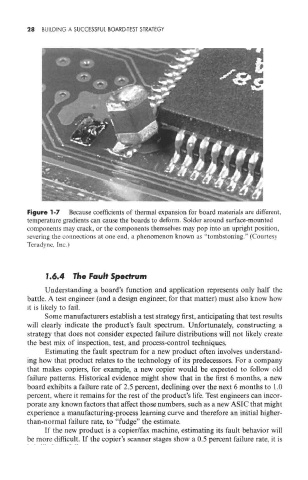
Figure 1-7 Because coefficients of thermal expansion for board materials are different,
temperature gradients can cause the boards to deform. Solder around surface-mounted
components may crack, or the components themselves may pop into an upright position,
severing the connections at one end, a phenomenon known as "tornbstoning." (Courtesy
Teradyne, Inc.)
1.6.4 The Fault Spectrum
Understanding a board's function and application represents only half the
battle. A test engineer (and a design engineer, for that matter) must also know how
it is likely to fail.
Some manufacturers establish a test strategy first, anticipating that test results
will clearly indicate the product's fault spectrum. Unfortunately, constructing a
strategy that does not consider expected failure distributions will not likely create
the best mix of inspection, test, and process-control techniques.
Estimating the fault spectrum for a new product often involves understand-
ing how that product relates to the technology of its predecessors. For a company
that makes copiers, for example, a new copier would be expected to follow old
failure patterns. Historical evidence might show that in the first 6 months, a new
board exhibits a failure rate of 2.5 percent, declining over the next 6 months to 1.0
percent, where it remains for the rest of the product's life. Test engineers can incor-
porate any known factors that affect those numbers, such as a new ASIC that might
experience a manufacturing-process learning curve and therefore an initial higher-
than-normal failure rate, to "fudge" the estimate.
If the new product is a copier/fax machine, estimating its fault behavior will
be more difficult. If the copier's scanner stages show a 0.5 percent failure rate, it is