
Page 44 - Building A Succesful Board-Test Strategy
P. 44
30 BUILDING A SUCCESSFUL BOARD-TEST STRATEGY
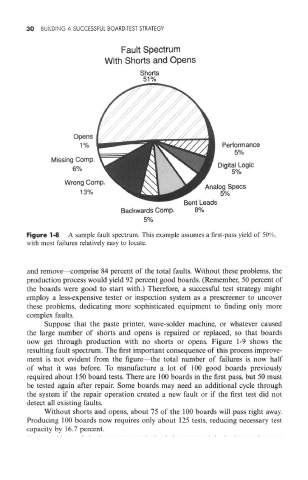
Figure 1-8 A sample fault spectrum. This example assumes a first-pass yield of 50%,
with most failures relatively easy to locate.
and remove—comprise 84 percent of the total faults. Without these problems, the
production process would yield 92 percent good boards. (Remember, 50 percent of
the boards were good to start with.) Therefore, a successful test strategy might
employ a less-expensive tester or inspection system as a prescreener to uncover
these problems, dedicating more sophisticated equipment to finding only more
complex faults.
Suppose that the paste printer, wave-solder machine, or whatever caused
the large number of shorts and opens is repaired or replaced, so that boards
now get through production with no shorts or opens. Figure 1-9 shows the
resulting fault spectrum. The first important consequence of this process improve-
ment is not evident from the figure—the total number of failures is now half
of what it was before. To manufacture a lot of 100 good boards previously
required about 150 board tests. There are 100 boards in the first pass, but 50 must
be tested again after repair. Some boards may need an additional cycle through
the system if the repair operation created a new fault or if the first test did not
detect all existing faults.
Without shorts and opens, about 75 of the 100 boards will pass right away.
Producing 100 boards now requires only about 125 tests, reducing necessary test
capacity by 16.7 percent.