
Page 46 - Building A Succesful Board-Test Strategy
P. 46
32 BUILDING A SUCCESSFUL BOARD-TEST STRATEGY
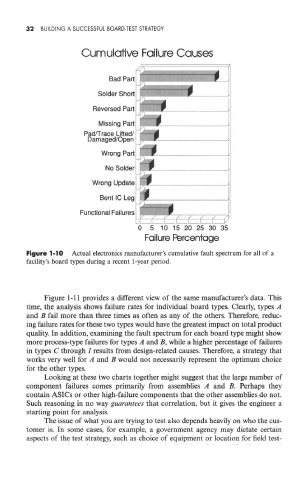
Figure 1-10 Actual electronics manufacturer's cumulative fault spectrum for all of a
facility's board types during a recent 1-year period.
Figure 1-11 provides a different view of the same manufacturer's data. This
time, the analysis shows failure rates for individual board types. Clearly, types A
and B fail more than three times as often as any of the others. Therefore, reduc-
ing failure rates for these two types would have the greatest impact on total product
quality. In addition, examining the fault spectrum for each board type might show
more process-type failures for types A and B, while a higher percentage of failures
in types C through / results from design-related causes. Therefore, a strategy that
works very well for A and B would not necessarily represent the optimum choice
for the other types.
Looking at these two charts together might suggest that the large number of
component failures comes primarily from assemblies A and B. Perhaps they
contain ASICs or other high-failure components that the other assemblies do not.
Such reasoning in no way guarantees that correlation, but it gives the engineer a
starting point for analysis.
The issue of what you are trying to test also depends heavily on who the cus-
tomer is. In some cases, for example, a government agency may dictate certain
aspects of the test strategy, such as choice of equipment or location for field test-