
Page 45 - Building A Succesful Board-Test Strategy
P. 45
What Is a Test Strategy? 31
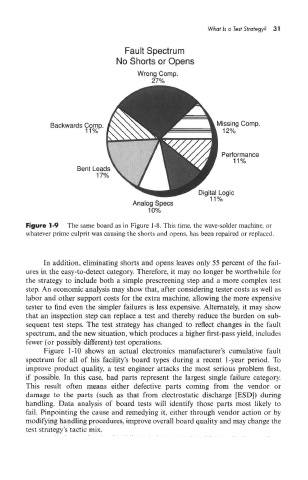
Figure 1-9 The same board as in Figure 1-8. This time, the wave-solder machine, or
whatever prime culprit was causing the shorts and opens, has been repaired or replaced.
In addition, eliminating shorts and opens leaves only 55 percent of the fail-
ures in the easy-to-detect category. Therefore, it may no longer be worthwhile for
the strategy to include both a simple prescreening step and a more complex test
step. An economic analysis may show that, after considering tester costs as well as
labor and other support costs for the extra machine, allowing the more expensive
tester to find even the simpler failures is less expensive. Alternately, it may show
that an inspection step can replace a test and thereby reduce the burden on sub-
sequent test steps. The test strategy has changed to reflect changes in the fault
spectrum, and the new situation, which produces a higher first-pass yield, includes
fewer (or possibly different) test operations.
Figure 1-10 shows an actual electronics manufacturer's cumulative fault
spectrum for all of his facility's board types during a recent 1-year period. To
improve product quality, a test engineer attacks the most serious problem first,
if possible. In this case, bad parts represent the largest single failure category.
This result often means either defective parts coming from the vendor or
damage to the parts (such as that from electrostatic discharge [BSD]) during
handling. Data analysis of board tests will identify those parts most likely to
fail. Pinpointing the cause and remedying it, either through vendor action or by
modifying handling procedures, improve overall board quality and may change the
test strategy's tactic mix.