
Page 237 - Buried Pipe Design
P. 237
Design of Pressure Pipes 211
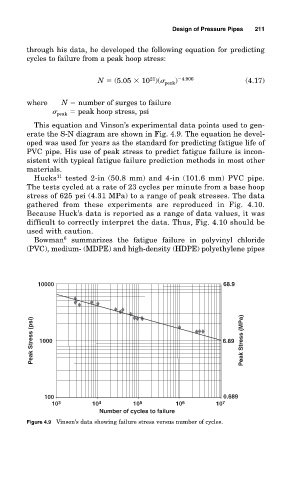
through his data, he developed the following equation for predicting
cycles to failure from a peak hoop stress:
21
N (5.05 10 )( peak ) 4.906 (4.17)
where N number of surges to failure
peak peak hoop stress, psi
This equation and Vinson’s experimental data points used to gen-
erate the S-N diagram are shown in Fig. 4.9. The equation he devel-
oped was used for years as the standard for predicting fatigue life of
PVC pipe. His use of peak stress to predict fatigue failure is incon-
sistent with typical fatigue failure prediction methods in most other
materials.
Hucks 11 tested 2-in (50.8 mm) and 4-in (101.6 mm) PVC pipe.
The tests cycled at a rate of 23 cycles per minute from a base hoop
stress of 625 psi (4.31 MPa) to a range of peak stresses. The data
gathered from these experiments are reproduced in Fig. 4.10.
Because Huck’s data is reported as a range of data values, it was
difficult to correctly interpret the data. Thus, Fig. 4.10 should be
used with caution.
Bowman 6 summarizes the fatigue failure in polyvinyl chloride
(PVC), medium- (MDPE) and high-density (HDPE) polyethylene pipes
10000 68.9
Peak Stress (psi) 1000 6.89 Peak Stress (MPa)
100 0.689
10 3 10 4 10 5 10 6 10 7
Number of cycles to failure
Figure 4.9 Vinson’s data showing failure stress versus number of cycles.