
Page 238 - Buried Pipe Design
P. 238
212 Chapter Four
5000 34.5
4000 27.6
Peak stress (psi) 3000 13.8 Peak stress (MPa)
20.7
2000
1000 6.9
0 0
10 4 10 5 10 6 10 7
Number of cycles to failure
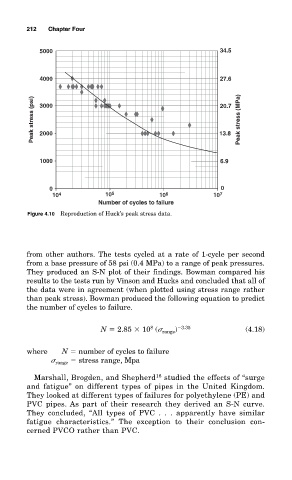
Figure 4.10 Reproduction of Huck’s peak stress data.
from other authors. The tests cycled at a rate of 1-cycle per second
from a base pressure of 58 psi (0.4 MPa) to a range of peak pressures.
They produced an S-N plot of their findings. Bowman compared his
results to the tests run by Vinson and Hucks and concluded that all of
the data were in agreement (when plotted using stress range rather
than peak stress). Bowman produced the following equation to predict
the number of cycles to failure.
8
N 2.85 10 ( range ) 3.35 (4.18)
where N number of cycles to failure
range stress range, Mpa
Marshall, Brogden, and Shepherd 16 studied the effects of “surge
and fatigue” on different types of pipes in the United Kingdom.
They looked at different types of failures for polyethylene (PE) and
PVC pipes. As part of their research they derived an S-N curve.
They concluded, “All types of PVC . . . apparently have similar
fatigue characteristics.” The exception to their conclusion con-
cerned PVCO rather than PVC.