
Page 243 - Buried Pipe Design
P. 243
Design of Pressure Pipes 217
TABLE 4.9 Summary of Test Results and Predicted Values
Minimum Predicted number of cycles to failure
cycles to
Test failure Vinson Bowman Hucks Marshall
One >10 million 322,432 7.7 million 600,000 10 million
Two 3,292,576 131,818 932,000 250,000 1.5 million
Three 36,300 44,110 11,000 90,000 30,000
Four 262,000 52,091 62,000 100,000 100,000
Corrected theory for cyclic life of PVC pipe. It was desired to use additional
22
sources of fatigue data in developing a new correlation. Vinson’s ,
11
6
16
Bowman’s , Hucks’ , and Marshall’s data were compiled and examined.
It was determined that Bowman’s and Marshall’s data were obtained
using PVC that was manufactured in England with a slightly different
formulation. Therefore, their data would be disregarded. Hucks’ data had
a range of number of cycles to failure making the data difficult to inter-
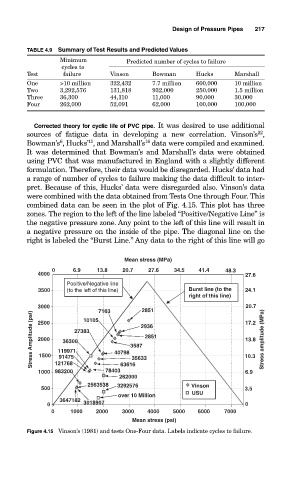
pret. Because of this, Hucks’ data were disregarded also. Vinson’s data
were combined with the data obtained from Tests One through Four. This
combined data can be seen in the plot of Fig. 4.15. This plot has three
zones. The region to the left of the line labeled “Positive/Negative Line” is
the negative pressure zone. Any point to the left of this line will result in
a negative pressure on the inside of the pipe. The diagonal line on the
right is labeled the “Burst Line.” Any data to the right of this line will go
Mean stress (MPa)
0 6.9 13.8 20.7 27.6 34.5 41.4 48.3
4000 27.6
Positive/Negative line
3500 (to the left of this line) Burst line (to the 24.1
right of this line)
20.7
3000 10105 7163 2851 17.2
Stress Amplitude (psi) 2000 119971 27383 40798 3587 2936 13.8 Stress amplitude (MPa)
2500
2851
36300
1500
10.3
91475
35633
121768
1000 983200 78403 63616 6.9
262000
2563538 3292576 Vinson
500 3.5
USU
over 10 Million
3647182
0 3018907 0
0 1000 2000 3000 4000 5000 6000 7000
Mean stress (psi)
Figure 4.15 Vinson’s (1981) and tests One-Four data. Labels indicate cycles to failure.