Page 245 - Buried Pipe Design
P. 245

Design of Pressure Pipes  219

                                    Mean Stress (MPa)
                0     6.9   13.8   20.7   27.6   34.5   41.4   48.3
            4000                                                     27.6
                                                             Vinson
            3500                                                     24.1
                    Positive/Negative Line                   USU
            3000                                                     20.7
           Stress Amplitude (psi)  2500  1.E+4           Burst Line  17.2 Stress Amplitude (MPa)

                                       Cycles to failure
                                                                     13.8
            2000
            1500
                                                                     10.3
            1000                  5.E+4       2.E+4                  6.9
                                2.E+5         1.E+5
                                1.E+6      5.E+5
             500                                                     3.5
                                 10.E+6       3.E+6
                     40.E+6
               0                                                     0
                0     1000   2000  3000   4000   5000   6000   7000
                                    Mean stress (psi)
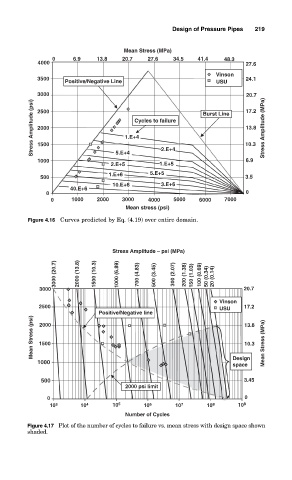
          Figure 4.16 Curves predicted by Eq. (4.19) over entire domain.


                                 Stress Amplitude – psi (MPa)
                 3000 (20.7)  2000 (13.8)  1500 (10.3)  1000 (6.89)  700 (4.83)  500 (3.45)  300 (2.07)  200 (1.38)  150 (1.03)  100 (0.69)  50 (0.34)  20 (0.14)


             3000                                                    20.7
                                                              Vinson
             2500                                             USU    17.2
                             Positive/Negative line                  13.8
           Mean Stress (psi)  1500                                   10.3  Mean Stress (MPa)
             2000


            1000                                                 Design
                                                                 space
             500                                                     3.45
                                    2000 psi limit
               0                                                     0
                10 3    10 4     10 5    10 6     10 7    10 8     10 9
                                    Number of Cycles
          Figure 4.17 Plot of the number of cycles to failure vs. mean stress with design space shown
          shaded.
   240   241   242   243   244   245   246   247   248   249   250