
Page 244 - Buried Pipe Design
P. 244
218 Chapter Four
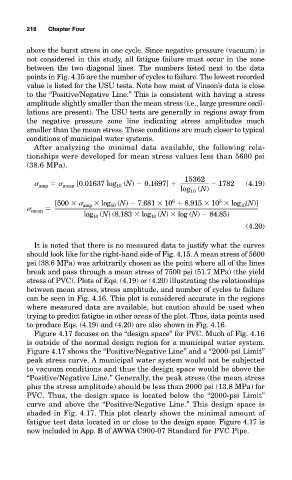
above the burst stress in one cycle. Since negative pressure (vacuum) is
not considered in this study, all fatigue failure must occur in the zone
between the two diagonal lines. The numbers listed next to the data
points in Fig. 4.15 are the number of cycles to failure. The lowest recorded
value is listed for the USU tests. Note how most of Vinson’s data is close
to the “Positive/Negative Line.” This is consistent with having a stress
amplitude slightly smaller than the mean stress (i.e., large pressure oscil-
lations are present). The USU tests are generally in regions away from
the negative pressure zone line indicating stress amplitudes much
smaller than the mean stress. These conditions are much closer to typical
conditions of municipal water systems.
After analyzing the minimal data available, the following rela-
tionships were developed for mean stress values less than 5600 psi
(38.6 MPa).
15362
amp mean [0.01637 log 10 (N) 0.1697] 1782 (4.19)
log 10 (N)
6
[500 amp log (N) 7.681 10 8.915 10 log (N)]
5
10
10
mean
log (N) (8.183 log (N) log (N) 84.85)
10
10
(4.20)
It is noted that there is no measured data to justify what the curves
should look like for the right-hand side of Fig. 4.15. A mean stress of 5600
psi (38.6 MPa) was arbitrarily chosen as the point where all of the lines
break and pass through a mean stress of 7500 psi (51.7 MPa) (the yield
stress of PVC). Plots of Eqs. (4.19) or (4.20) illustrating the relationships
between mean stress, stress amplitude, and number of cycles to failure
can be seen in Fig. 4.16. This plot is considered accurate in the regions
where measured data are available, but caution should be used when
trying to predict fatigue in other areas of the plot. Thus, data points used
to produce Eqs. (4.19) and (4.20) are also shown in Fig. 4.16.
Figure 4.17 focuses on the “design space” for PVC. Much of Fig. 4.16
is outside of the normal design region for a municipal water system.
Figure 4.17 shows the “Positive/Negative Line” and a “2000-psi Limit”
peak stress curve. A municipal water system would not be subjected
to vacuum conditions and thus the design space would be above the
“Positive/Negative Line.” Generally, the peak stress (the mean stress
plus the stress amplitude) should be less than 2000 psi (13.8 MPa) for
PVC. Thus, the design space is located below the “2000-psi Limit”
curve and above the “Positive/Negative Line.” This design space is
shaded in Fig. 4.17. This plot clearly shows the minimal amount of
fatigue test data located in or close to the design space. Figure 4.17 is
now included in App. B of AWWA C900-07 Standard for PVC Pipe.