
Page 242 - Buried Pipe Design
P. 242
216 Chapter Four
TABLE 4.8 Number of Cycles to Failure for Tests Two,Three, and Four
Test Two Test Three Test Four
Cycles to Cycles to Cycles to
Pipe # failure Pipe # failure Pipe # failure
3 3.29E6 2 36,300 4 262,711
4 9.67E6 1 43,900 5 273,881
1,2,5 >11.E6 3, 4, 5 47,400 2 280,501
1, 3 284,029
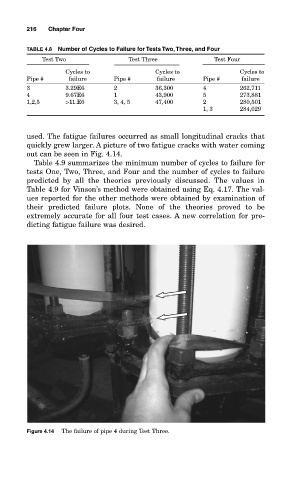
used. The fatigue failures occurred as small longitudinal cracks that
quickly grew larger. A picture of two fatigue cracks with water coming
out can be seen in Fig. 4.14.
Table 4.9 summarizes the minimum number of cycles to failure for
tests One, Two, Three, and Four and the number of cycles to failure
predicted by all the theories previously discussed. The values in
Table 4.9 for Vinson’s method were obtained using Eq. 4.17. The val-
ues reported for the other methods were obtained by examination of
their predicted failure plots. None of the theories proved to be
extremely accurate for all four test cases. A new correlation for pre-
dicting fatigue failure was desired.
Figure 4.14 The failure of pipe 4 during Test Three.