
Page 149 - Business Plans that Work A Guide for Small Business
P. 149
140 • Business Plans that Work
support overhead in place, although this strategy has the benefit of enabling
rapid expansion at a relatively lower cost.
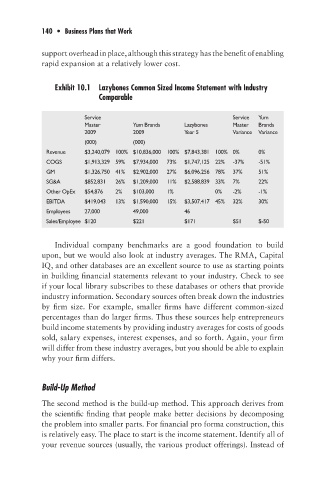
Exhibit 10.1 Lazybones Common Sized Income Statement with Industry
Comparable
Service Service Yum
Master Yum Brands Lazybones Master Brands
2009 2009 Year 5 Variance Variance
(000) (000)
Revenue $3,240,079 100% $10,836,000 100% $7,843,381 100% 0% 0%
COGS $1,913,329 59% $7,934,000 73% $1,747,125 22% -37% -51%
GM $1,326,750 41% $2,902,000 27% $6,096,256 78% 37% 51%
SG&A $852,831 26% $1,209,000 11% $2,588,839 33% 7% 22%
Other OpEx $54,876 2% $103,000 1% 0% -2% -1%
EBITDA $419,043 13% $1,590,000 15% $3,507,417 45% 32% 30%
Employees 27,000 49,000 46
Sales/Employee $120 $221 $171 $51 $-50
Individual company benchmarks are a good foundation to build
upon, but we would also look at industry averages. The RMA, Capital
IQ, and other databases are an excellent source to use as starting points
in building financial statements relevant to your industry. Check to see
if your local library subscribes to these databases or others that provide
industry information. Secondary sources often break down the industries
by firm size. For example, smaller firms have different common-sized
percentages than do larger firms. Thus these sources help entrepreneurs
build income statements by providing industry averages for costs of goods
sold, salary expenses, interest expenses, and so forth. Again, your firm
will differ from these industry averages, but you should be able to explain
why your firm differs.
Build-Up Method
The second method is the build-up method. This approach derives from
the scientific finding that people make better decisions by decomposing
the problem into smaller parts. For financial pro forma construction, this
is relatively easy. The place to start is the income statement. Identify all of
your revenue sources (usually, the various product offerings). Instead of