
Page 152 - Business Plans that Work A Guide for Small Business
P. 152
Financial Plan: Telling Your Story in Numbers • 143
Lazybones Financial Plan
Section 10: Financials
The development plan outlined in Section 6 will result in dramatic increases in
Lazybones’s financial performance. In five years we expect:
The first major
section provides a high-
• Annual revenue increase of 6× level overview of the major
• Annual net profit increase of 10× assumptions that drive the
projections.
• Annual cash flow increases of 5×
We will accomplish this by opening four new company stores and 60 new
franchises on the timeline shown in Exhibit 6.1.
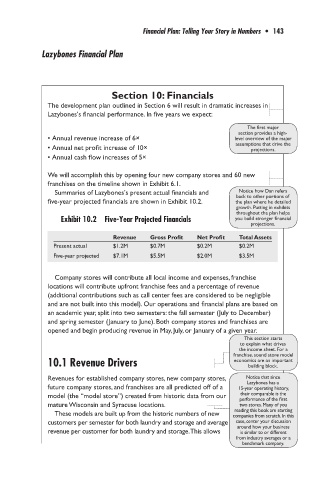
Summaries of Lazybones’s present actual financials and Notice how Dan refers
back to other portions of
five-year projected financials are shown in Exhibit 10.2. the plan where he detailed
growth. Putting in exhibits
throughout the plan helps
Exhibit 10.2 Five-Year Projected Financials you build stronger financial
projections.
Revenue Gross Profit Net Profit Total Assets
Present actual $1.2M $0.7M $0.2M $0.2M
Five-year projected $7.1M $5.5M $2.0M $3.5M
Company stores will contribute all local income and expenses, franchise
locations will contribute upfront franchise fees and a percentage of revenue
(additional contributions such as call center fees are considered to be negligible
and are not built into this model). Our operations and financial plans are based on
an academic year, split into two semesters: the fall semester (July to December)
and spring semester (January to June). Both company stores and franchises are
opened and begin producing revenue in May, July, or January of a given year.
This section starts
to explain what drives
the income sheet. For a
franchise, sound store model
10.1 Revenue Drivers e conomics are an important
building block.
Revenues for established company stores, new company stores, Notice that since
L azybones has a
future company stores, and franchises are all predicted off of a 15-year o perating h istory,
their c omparable is the
model (the “model store”) created from historic data from our p erformance of the first
mature Wisconsin and Syracuse locations. two stores. Many of you
reading this book are starting
These models are built up from the historic numbers of new c ompanies from scratch. In this
customers per semester for both laundry and storage and average case, center your discussion
revenue per customer for both laundry and storage. This allows around how your business
is similar to or different
from industry averages or a
b enchmark company.