
Page 162 - Business Plans that Work A Guide for Small Business
P. 162
Downloaded by [ Singapore Polytechnic Library 85.244.23.165] at [06/24/18]. Copyright © McGraw-Hill Global Education Holdings, LLC. Not to be redistributed or modified in any way without permission.
$1,747,125
$1,747,125
$1,767,146
$2,837,065
$6,125,353
$6,144,474
$4,034,117
$2,110,357
$1,188,320
$1,624,546
$3,543,277
$7,891,599
$694,061
$178,721
$730,544
$730,544
$875,000
$289,779
$283,265
$892,146
$178,721
$976,651
$210,164
$947,308
$879,892
$12,358
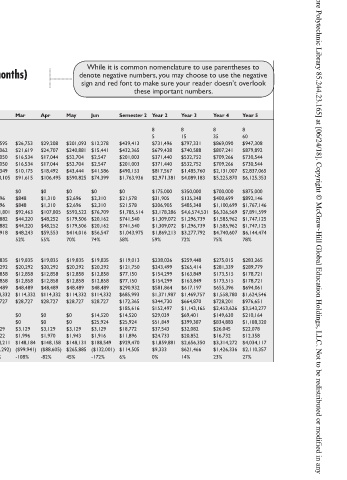
While it is common nomenclature to use parentheses to denote negative numbers, you may choose to use the negative sign and red font to make sure your reader doesn’t overlook these important numbers. Year 4 Year 3 Year 2 Semester 2 8 8 8 8 60 35 15 5 $869,090 $797,331 $731,496 $439,413 $807,241 $740,588 $679,438 $43
$22,078
Year 5
27%
78%
May Jun $12,278 $201,093 $15,441 $240,881 $2,547 $52,704 $2,547 $52,704 $41,586 $43,444 $74,399 $590,825 $0 $0 $2,310 $2,696 $2,310 $2,696 $76,709 $593,522 $20,162 $179,506 $20,162 $179,506 $56,547 $414,016 74% 70% $19,835 $19,835 $20,292 $20,292 $12,858 $12,858 $12,858
Apr $29,208 $24,707 $17,044 $17,044 $18,492 $106,495 $0 $1,310 $1,310 $107,805 $48,252 $48,252 $59,553 55% $19,835 $20,292 $12,858 $12,858 $48,489 $114,332 $28,727 $0 $0 $3,129 $1,970 $148,158 ($88,605) -82%
Exhibit 10.7: Five-Year Income Statement (detailed for first 18 months)
Mar $26,753 $21,619 $16,534 $16,534 $10,175 $91,615 $0 $848 $848 $92,463 $44,220 $44,220 $48,243 52% $19,835 $20,292 $12,858 $12,858 $48,489 $114,332 $28,727 $0 $0 $3,129 $1,996 $148,184 ($99,941) -108%
Feb $48,595 $37,062 $32,050 $32,050 $20,349 $170,105 $0 $1,696 $1,696 $171,801 $84,882 $84,882 $86,918 51% $19,835 $20,292 $12,858 $12,858 $48,489 $114,332 $28,727 $0 $0 $3,129 $2,022 $148,211 ($61,292) -36%
$121,486 $92,655 $80,124 $80,124 $356,108 $730,497 $12,718 $12,718 $743,215 $364,518 $364,518 $378,697 $19,835 $20,292 $12,858 $12,858 $48,489 $114,332 $28,727 $3,129 $2,049 $148,237 $230,460
Jan $0 51% $0 $0 31%
Semester 8 5 $292,083 $247,073 $170,437 $170,437 $327,414 $1,207,445 $175,000 $10,327 $185,327 $1,392,772 $567,533 $567,533 $825,239 59% $119,013 $121,750 $77,150 $77,150 $290,932 $685,993 $172,365 ($33,119) $14,520 $25,924 $18,772 $12,837 $930,411 ($105,172) -8%
Dec $48,852 $49,413 $16,025 $21,119 $37,441 $177,945 $0 $2,272 $2,272 $180,217 $68,775 $68,775 $111,442 62% $19,835 $20,292 $12,858 $12,858 $48,489 $114,332 $28,727 $14,520 $25,924 $3,129 $2,075 $188,707 ($77,265) -43%
Nov $24,297 $18,531 $16,025 $16,025 $30,524 $105,401 $0 $2,120 $2,120 $107,521 $52,595 $52,595 $54,926 51% $19,835 $20,292 $12,858 $12,858 $48,489 $114,332 $28,727 $0 $0 $3,129 $2,101 $148,289 ($93,363) -87%
Oct $24,297 $18,531 $80,124 $16,025 $45,785 $120,663 $0 $2,798 $2,798 $123,461 $60,211 $60,211 $63,250 51% $19,835 $20,292 $12,858 $12,858 $48,489 $114,332 $28,727 $0 $0 $3,129 $2,127 $148,315 ($85,065) -69%
Sept $121,486 $92,655 $34,597 $80,124 $152,618 $527,007 $0 $2,120 $2,120 $529,127 $262,977 $262,977 $266,150 50% $19,835 $20,292 $12,858 $12,858 $48,489 $114,332 $28,727 $0 $0 $3,129 $2,153 $148,341 $117,809 22%
Aug $60,872 $52,503 $34,597 $34,597 $61,047 $243,616 $0 $1,017 $1,017 $244,633 $114,083 $114,083 $130,550 53% $19,835 $20,292 $12,858 $12,858 $48,489 $114,332 $28,727 $0 $0 $3,129 $2,178 $148,366 ($17,816) -7%
July 8 5 $12,278 $15,441 $2,547 $2,547 $0 $32,813 $175,000 $0 $175,000 $207,813 $8,892 $8,892 $198,921 96% $19,835 $20,292 $12,858 $12,858 $48,489 $114,332 $28,727 $0 $0 $3,129 $2,204 $148,392 $50,529 24%
Part B: Years 2–5 T otal number of owned stores T otal number of franchises Additional owned stores Owned store contribution Franchise contribution Gross profit % Additional owned stores Owned store interest Net profit margin
Revenue Syracuse total Wisconsin total Boston Colorado Franchises Franchise fees Franchise % T otal revenue Owned stores COGS T otal COGS Gross profit Owned store SG&A Syracuse Wisconsin Boston Colorado Owned store SG&A Corporate SG&A EBITDA Owned store taxes Corporate taxes Corporate int
Expenses
151