
Page 160 - Business Plans that Work A Guide for Small Business
P. 160
Downloaded by [ Singapore Polytechnic Library 85.244.23.165] at [06/24/18]. Copyright © McGraw-Hill Global Education Holdings, LLC. Not to be redistributed or modified in any way without permission.
$1,358,133
$1,160,342
$1,757,323
($526,105)
($596,981)
$872,835
$872,835
$364,631
$606,641
$204,392
$204,392
$145,566
$637,268
$328,314
$212,523
$217,410
$145,566
$653,121
$28,388
$42,849
Year 1
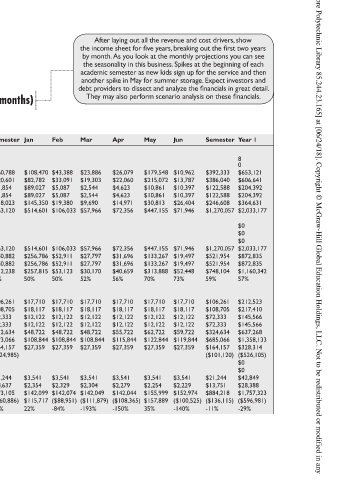
After laying out all the revenue and cost drivers, show the income sheet for five years, breaking out the first two years by month. As you look at the monthly projections you can see the seasonality in this business. Spikes at the beginning of each academic semester as new kids sign up for the service and then another spike in May for summe
$108,470 $43,388 $145,350 $19,380 $514,601 $106,033 $514,601 $106,033 $256,786 $52,911 $256,786 $52,911 $257,815 $53,123 $108,844 $108,844 $142,099 $142,074 $115,717 ($88,951)
Feb Mar $23,886 $19,303 $33,091 $2,544 $5,087 $2,544 $5,087 $9,690 $57,966 $57,966 $27,797 $27,797 $30,170 52% 50% $17,710 $17,710 $18,117 $18,117 $12,122 $12,122 $12,122 $12,122 $48,722 $48,722 $108,844 $27,359 $27,359 $3,541 $3,541 $2,304 $2,329 $142,049 ($111,
Jan $82,782 $89,027 $89,027 50% $17,710 $18,117 $12,122 $12,122 $48,722 $27,359 $3,541 $2,354 22%
Five-Year Income Statement (detailed for first 18 months)
Semester 8 0 $260,788 $220,601 $81,854 $81,854 $118,023 $763,120 $763,120 $350,882 $350,882 $412,238 54% $106,261 $108,705 $72,333 $72,333 $312,634 $673,066 $164,157 ($424,985) $21,244 $14,637 $873,105 ($460,886) -60%
Dec $43,618 $44,119 $9,360 $9,360 $25,968 $132,425 $132,425 $47,450 $47,450 $84,975 64% $17,710 $18,117 $12,122 $12,122 $45,722 $108,844 $27,359 $3,541 $2,379 $142,123 ($57,148) -43%
Nov $21,694 $16,546 $7,631 $7,631 $24,225 $77,726 $77,726 $38,785 $38,785 $38,941 50% $17,710 $18,117 $12,122 $12,122 $45,722 $105,844 $27,359 $3,541 $2,403 $139,148 ($100,207) -129%
$21,694 $16,546 $11,446 $11,446 $31,977 $93,109 $93,109 $46,461 $46,461 $46,648 $17,710 $18,117 $12,122 $12,122 $45,722 $105,844 $27,359 $3,541 $2,428 $139,172 ($92,524)
Oct 50% -99%
Sept $108,470 $82,728 $38,141 $38,141 $24,225 $291,731 $291,731 $145,574 $145,574 $146,157 50% $17,710 $18,117 $12,122 $12,122 $52,722 $112,844 $27,359 $3,541 $2,452 $146,196 ($39) 0%
Aug July 8 0 $54,350 $10,962 $46,878 $13,787 $15,262 $15,262 $11,628 $143,379 $24,749 $143,379 $24,749 $65,903 $6,707 $65,903 $6,707 $77,476 $18,042 54% 73% $17,710 $17,710 $18,117 $18,117 $12,122 $12,122 $12,122 $12,122 $59,722 $59,722 $119,844 $119,844 $27,359
10.3 Income Statement Exhibit 10.7 Part A: Year 1 T otal number of owned stores T otal number of franchises Syracuse total Wisconsin total Additional owned stores Owned store contribution Franchise fees Franchise contribution Gross profit % Additional owned stores Owned store taxes Owned store interest Corporate interest N
Revenue Boston Colorado Franchise Franchise % T otal revenue Owned stores COGS T otal COGS Gross profit Expenses Owned store SG&A Syracuse Wisconsin Boston Colorado Owned store S
150